Key Takeaways
- After much anticipation, Coinbase Global's (NASDAQ:COIN) direct listing on NASDAQ went off with much fanfare as the industry enjoyed some long-awaited validation.
- Events outside of the United States rocked Bitcoin last week. Simultaneously, Ethereum hit a new all-time high of $2,500.
- The market may have finally called a top as many traders are now nabbing profits and putting them to work in DeFi’s favorite “yield farm.”
This week’s wNews digs into why various left-of-the-curve cryptocurrencies enjoyed some serious bullish attention. So hard did 2017’s favorite altcoins pump that the market quickly forgot about the industry’s first-ever direct listing.
Dogecoin swept headlines, but other altcoins like Ethereum Classic, Bitcoin Cash, and Litecoin all took flight last week. There are several reasons why this activity was strange and worrisome to investors.
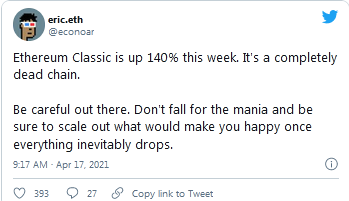
Dogecoin’s repo on GitHub is absent of activity, and Ethereum Classic has already suffered from two 51% attacks. Neither facts suggested either project was fundamentally strong. As for the rest of the market, who knows.
Elsewhere, Bitcoin and Ethereum traded price action. Bitcoin dropped after being banned in Turkey, and a mining accident in China reduced the network’s hashrate. Thanks to positive scalability news, ETH hit an all-time high just a day after Coinbase was listed on NASDAQ.
This week’s volatility has already spooked some traders, however. For those moving into stablecoins, this week’s Crypto To-Do List introduces readers to a convenient way to earn up to 15% on their idle holdings.
All that and much more below.
Digging into Dogecoin, Not Coinbase
It’s perfectly reasonable in crypto that the industry’s greatest moment of validation is eclipsed by the inordinate pumping of a “meme coin.” Just as Wall Street finally perks up to crypto, market participants remind them that the sector is still growing.
Unpacking this juxtaposition, however, does reveal several curious insights. First Dogecoin.
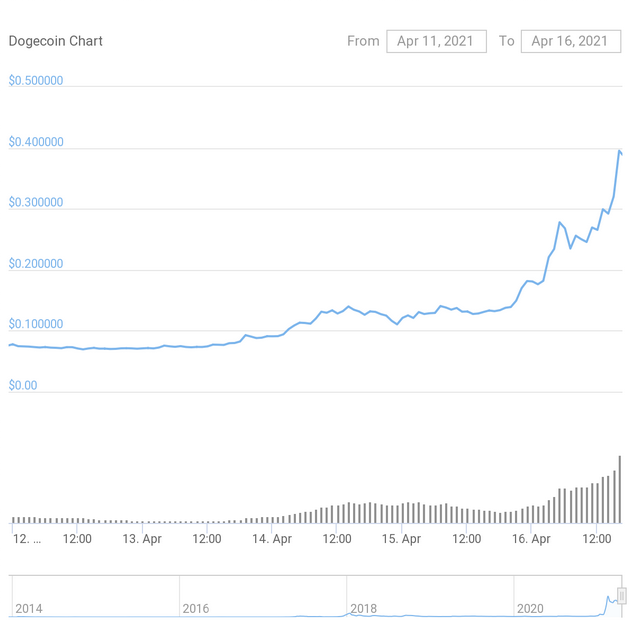
Headline after headline, tweet after tweet, commentators overthought the underlying reasons as to why DOGE rose from $0.07 to $0.41 in under a week. The money-as-a-meme narrative was certainly at play.
But there was another unexpected motor that pushed the coin to new highs.
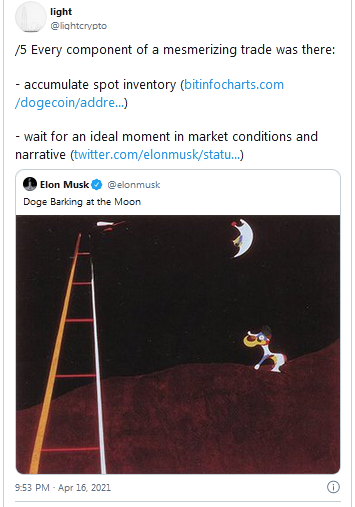
Like all strange money matters, it involved a tweet from Elon Musk. Alongside the serial memester, the Dogecoin pump also involved a “truly exceptional” trader.
When inspecting the top DOGE wallets, one particular address stood out last week. Looking through this account’s activity, one can see what looks like a massive campaign to lure and bait speculators.
100,000,000 DOGE sold here, 250,000,000 sold there. With such volume, it’s not difficult for a single address to move prices.

Once this information became clear to the public, and Twitter threads revealed the carnage, another unusual document emerged: God.pdf.
Written by another trader named Wolong, the document described the precise tactics put in play in the latest Dogecoin action. It revealed how whales could delicately manipulate price and volume in seven key steps. What’s more, Wolong was notorious for controlling the price of DOGE before disappearing.
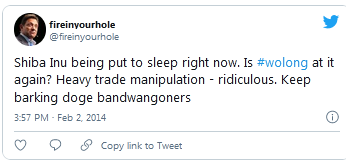
The first step is position building, or slowly making “microbuys” over a period and creating a large coffer of the specified token without disrupting prices. The second is price suppression.
Here the whale quells rising prices through wave after wave of sell walls. Wolong writes, “our sell walls are usually just enough to appear as though as it’s the invisible hands of the market, minor supply over demand.”
Step four is the test pump to shake out weak hands and “ensure that [whales] have absolute control of the market.” Step five is the actual pump, like what the market saw on Friday.
Step six is a re-allocation of the tokens, followed by step seven: “The Dump.”
After the general explainer, Wolong writes:
“By now, everyone should be very curious and if not dying to find out how I orchestrated my pumps and dumps, especially with dogecoin.”
In another March 2020 article from the Daily Dot, his technique was explained thusly:
“A Bitcoin trader who asked to remain anonymous told me Wolong was likely trading mostly with himself, ‘playing the part of the fighting whales’ (‘whales’ are traders with significant bankrolls). He described a pattern of trading where Wolong would make it appear that a whale was keeping the market below a certain price, and then play the part of a second whale buying enough Dogecoin to lift the price through the first whale’s resistance. Once the price broke that resistance, out-of-the-loop traders would buy more Dogecoin, hoping to see it rise even higher.”
Because Wolong had been executing these tactics long before last week’s pump, many experienced traders quickly drew comparisons.

With this bit of context in mind, calling “all money a meme” seems a bit silly.
And just like on Wall Street, if traders don’t know why prices are moving the way they are, they probably aren’t looking hard enough.
Either way, of course, retail will always be left holding the bags.
Market Action: Bitcoin
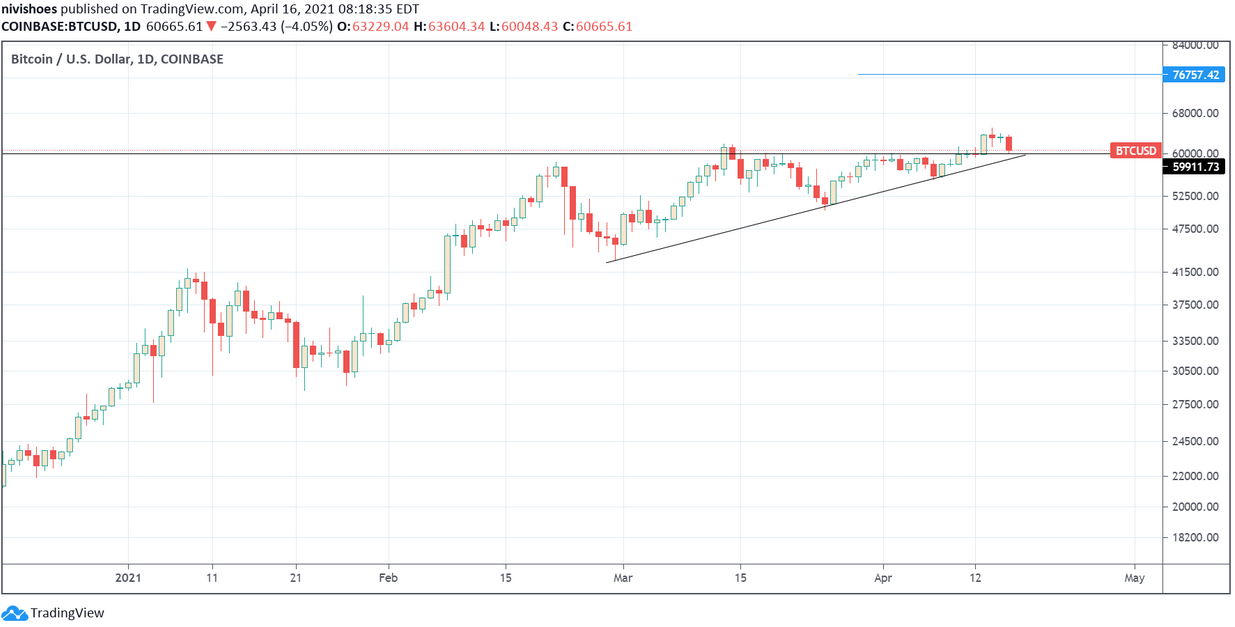
Bitcoin moved past the $60,000 resistance and recorded a 7.6% gain following the breakout.
The price retested support yesterday as negative catalysts from Turkey and China put pressure on the price. The ascending triangle target of $76,500 is still in action though.
The high funding rate for long BTC orders on Binance’s futures market suggests that fear is creeping in among traders.
For reference, on Wednesday, when Bitcoin broke above $60,000, the funding rates were above 0.1% across all platforms for an eight-hour interval or a 110% annual percent rate.

The derivatives market saw a $1.1 billion liquidation dominated in long orders after Friday's crash. Overall, the market still seems bullish.
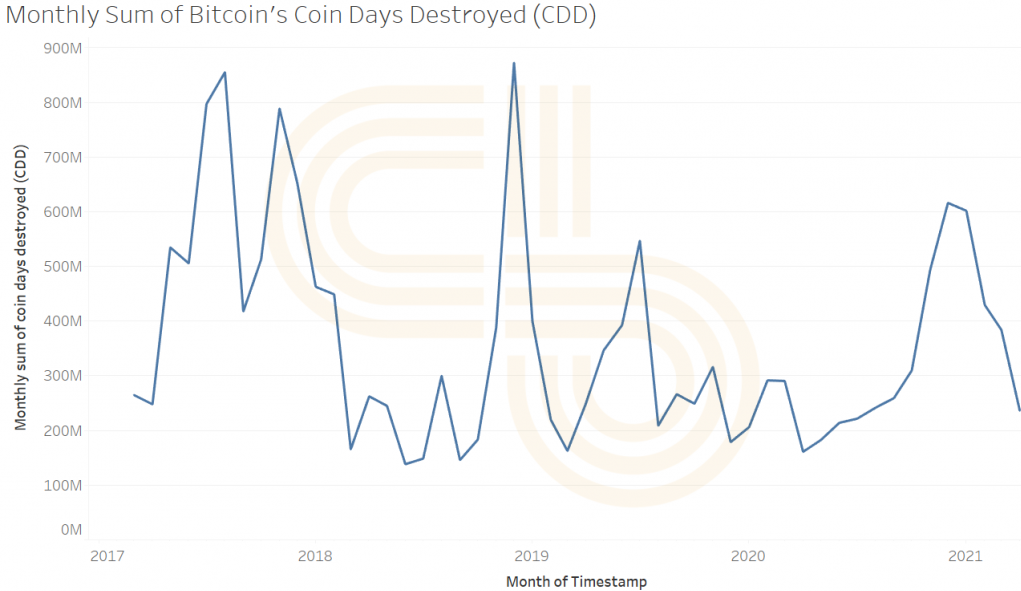
The Coin Days Destroyed (CDD) metric, which gauges the movement of old and large Bitcoin addresses, possibly moving to sell, continued to decline in March, which is a positive signal. It suggests that long-term holders are willing to wait for higher prices.
However, since the top of $64,500, reports of exchange deposits of nearly 16,000 Bitcoin (worth nearly $1 billion) have emerged.
First, analytics firm Crypto Quant reported a 5,047 BTC inflow on Thursday.
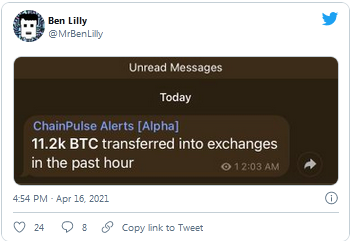
Then on Friday, after Bitcoin’s dip to $60,500, Ben Lilly of Jarvis Labs recorded a massive inflow of over 11,000 BTC, adding to the negative pressure over the weekend.
If the price drops further, the previous low of $55,600 will support the bulls.
Market Action: Ethereum
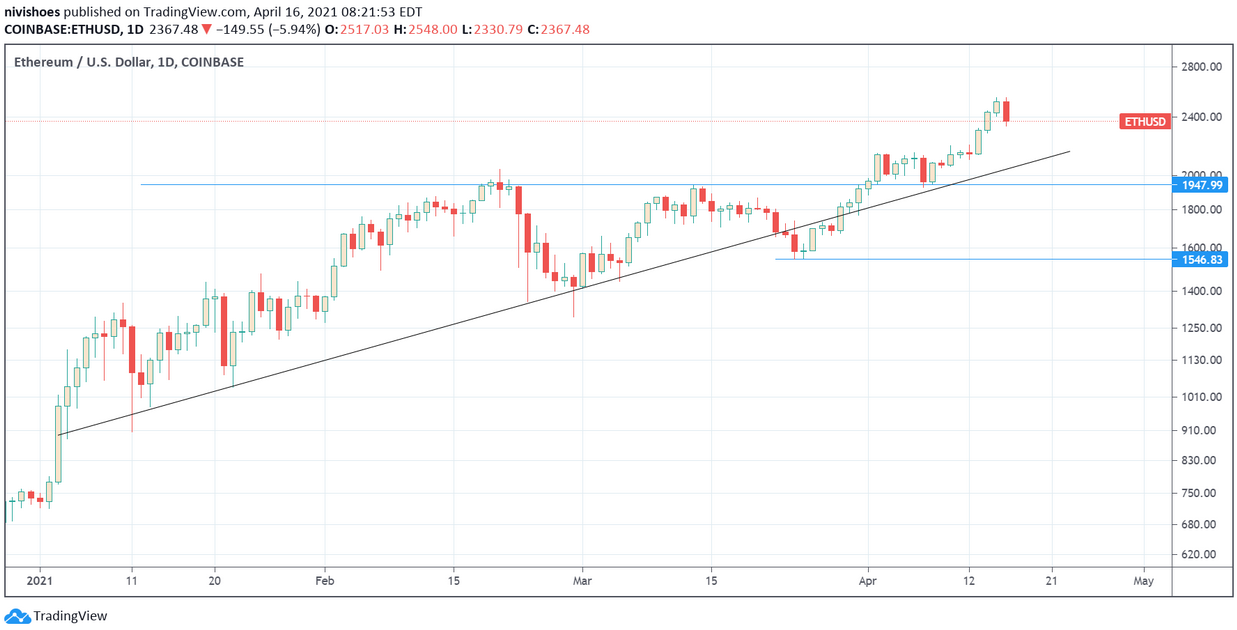
Ethereum’s native token ETH broke a new all-time high last week with positive development around the blockchain’s scalability issues.
The comparison between the daily chart of ETH and BTC revealed that the second-largest cryptocurrency was, in fact, leading the market.
Ether broke and retested the breakout from the ascending channel in the first week of April. In comparison, BTC followed a similar trajectory last week.
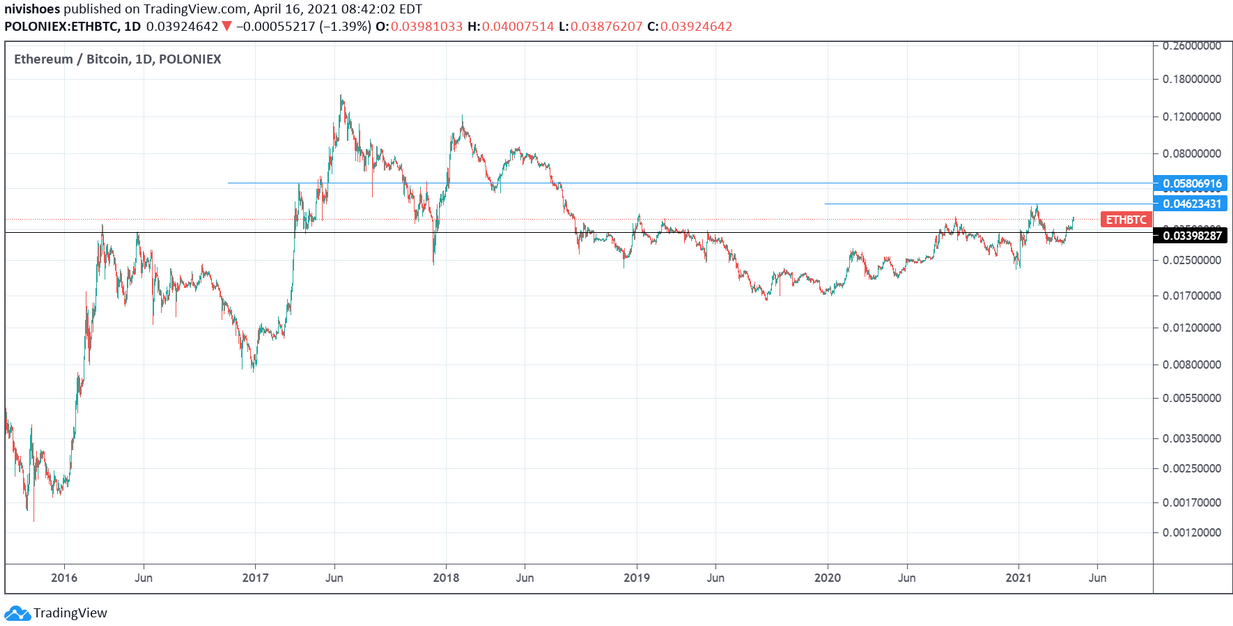
ETH/BTC also brings positive tidings as it trades above the pivotal value of 0.034 BTC.
Before stablecoins like USDT took over, Bitcoin was the dominant exchange pair in the market. However, in 2019 and 2020, the volume of USD pairs exploded on the spot and even the futures market.
Still, the levels of support and resistance in the ETH/BTC chart provide useful information about the change in market trends.
The 0.034 BTC level marks a pivotal point of decoupling between Bitcoin and Ethereum.
During the parabolic 2017 run, breakout and retest of this point acted as a robust trading indicator. Over the last two years, the price has held near this level, seeing upward resistance at 0.045 BTC and 0.058 BTC.
However, the funding rate of Ether is running hotter than Bitcoin, which is a concern for investors.
While the target of $2,750 and $3,000 is still on, traders must not rule out the possibility of a retest of the $2,100 support.
Crypto To-Do List: Use a Yield Optimization Tool
Crypto is deep into its biggest bull run to date, which means some are already beginning to take profits.
In the past, this usually meant exchanging from crypto to fiat via a centralized exchange. With the advent of DeFi, however, users needn’t move holdings outside of the crypto ecosystem.
DeFi, the majority of which occurs on the Ethereum blockchain, offers unrivaled yields, especially compared to any bank in the traditional world. This means that if and when a slump does hit, DeFi users will still be able to continue banking profits on their assets by putting their money to work.
“Yield farming,” as it’s popularly known, introduced a new layer to the crypto ecosystem, but it also added complexity. The best yield farming strategies can be difficult for casual users to find, however, and moving assets between liquidity pools can require heavy amounts of gas. Plus, as yield rates change with the number of assets deposited in a pool, it can be difficult to keep track of the best place to deposit funds.
Most users don’t have a lot of capital—in time or crypto—to invest in yield farming alone.
That problem has been solved with the arrival of yield optimization tools. Aggregators for some of DeFi’s leading projects, these protocols use smart contracts to find the best returns for users when they deposit their assets.
By far, the best-known yield optimization tool in DeFi today is Yearn.Finance.
Built by cult DeFi figure Andre Cronje in 2020, Yearn integrates Compound, Curve, Balancer, SushiSwap, Aave, and other DeFi mainstays. It offers a range of products, though they are designed to help users capture yield more efficiently (Cronje has said that he built it for himself).
With Yearn’s Vaults, users can deposit an asset, which Yearn users can access to borrow stablecoins and farm yield. The yield then gets exchanged to the same deposited asset, which the user can withdraw.
Earn is a similar product, designed specifically for stablecoins like DAI, TUSD, USDC, and USDT.
It also supports WBTC. The protocol also integrates cover options to protect assets.
Yield optimization tools like Yearn.Finance simplify the process of leveraging DeFi’s yield opportunities, creating new ways for users to move their assets without the heavy gas burden. Nonetheless, making a deposit and withdrawal from Yearn still requires gas.
Moreover, yield optimization tools are highly experimental, designed for more proficient DeFi users. As such, caution is advised.
