
Shares of Honda Motor Co., Ltd. (NYSE:HMC) increased by a penny to $29.83 on Oct 31 on higher earnings. The company reported consolidated income of ¥177 billion ($1.75 billion) or ¥98.26 per share (97 cents per ADR) in the second quarter (ended Sep 30, 2016) of fiscal 2017, up 38.6% from the year-ago quarter. Earnings per share surpassed the Zacks Consensus Estimate of 59 cents.
Consolidated net sales and other operating revenues went down 9.9% year over year to ¥3.26 trillion ($32.27 billion). The figure also missed the Zacks Consensus Estimate of $33.88 billion. The year-over-year decline can be attributed to unfavorable foreign currency translation effects which offset higher revenues in financial services business as well as automobile and motorcycle business operations.
Consolidated operating profit amounted to ¥228 billion ($2.26 billion), up 38.4% from the prior-year quarter. The improvement was backed by cost-reduction efforts, a decrease in selling, general and administrative (SG&A) expenses that include quality-related expenses, and the impact of pension accounting treatment. These factors offset the unfavorable currency effects.
Segment Performance
Revenues in the Automobile segment fell 10.7% to ¥2.34 trillion ($23.16 billion) owing to unfavorable foreign currency translation effects. Unit sales were almost in line with the year-ago period at 890,000 vehicles. Meanwhile, operating profit amounted to ¥131.8 billion ($1.3 billion), up 94.5% year over year, on cost-reduction efforts and the impact of pension accounting treatment.
Revenues in the Motorcycle segment decreased 9.7% to ¥409.3 billion ($4.05 billion) due to unfavorable foreign currency translation effects, which offset the 10.9% increase in consolidated unit sales to 3.04 million motorcycles. Operating income rose 21.3% to ¥59.5 billion ($589 million) owing to higher sales volume and model mix as well as cost-reduction efforts and the impact of pension accounting treatment.
Revenues in the Financial Services segment fell 4.1% to ¥443.2 billion ($4.38 billion) due to unfavorable foreign currency translation effects. Also, operating income declined 27.2% to ¥37.7 billion ($374 million) on higher SG&A expenses.
Revenues in the Power Product and Other segment fell 18.5% to ¥68.7 billion ($680 million) in the reported quarter. The decline resulted from lower consolidated unit sales in power product business. Unit sales in the segment dropped 3.1% to 1.24 million. The segment's operating loss was ¥1 billion ($10 million), narrower than the loss of ¥2.8 billion ($28 million) in the year-ago quarter due to lower SG&A expenses as well as the impact of pension accounting treatment.
Financial Position
Consolidated cash and cash equivalents amounted to ¥1.68 trillion ($16.6 billion) as of Sep 30, 2016, down from ¥1.76 trillion ($17.1 billion) as of Mar 31, 2016.
In first-half fiscal 2017, cash flow from operations plunged 44.4% to ¥392.1 billion ($3.88 billion). This decline was due to a decrease in cash received from customers, including unfavorable foreign currency translation effects, despite a lower payment for parts and raw materials.
Guidance
For fiscal 2017, Honda expects revenues to decline 8.2% to ¥13.4 trillion ($132.52 billion), lower than the previous guidance of ¥13.75 trillion ($130.95 billion). Operating income is likely to rise 29.1% to ¥650 billion ($6.43 billion), up from the previous estimate of ¥600 billion ($5.71 billion). Net income is projected to improve 20.5% to ¥415 billion ($4.1 billion) or ¥230.26 ($2.28) per share, up from the previous expectation of ¥390 billion ($3.71 billion) or ¥216.39 ($2.06) per share.
HONDA MOTOR Price, Consensus and EPS Surprise
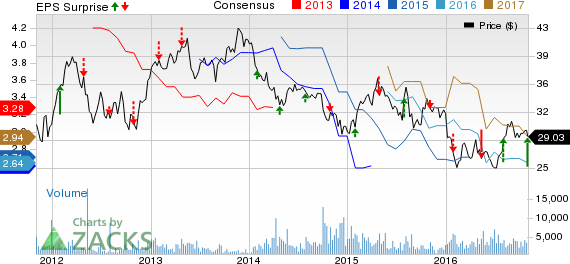
HONDA MOTOR Price, Consensus and EPS Surprise | HONDA MOTOR Quote
Zacks Rank
Currently, Honda has a Zacks Rank #4 (Sell).
Some better-ranked stocks in the auto space include Spartan Motors Inc. (NASDAQ:SPAR) , Gentex Corp. (NASDAQ:GNTX) and Standard Motor Products Inc. (NYSE:SMP) .
Standard Motor, with a long-term expected growth rate of 15%, sports a Zacks Rank #1 (Strong Buy). You can see the complete list of today’s Zacks #1 Rank stocks here.
Spartan Motors, carrying a Zacks Rank #2 (Buy), has a long-term expected growth rate of 15%.
Gentex, also a Zacks Rank #2 stock, has a long-term expected growth rate of 11.17%.
Confidential from Zacks
Beyond this Analyst Blog, would you like to see Zacks' best recommendations that are not available to the public? Our Executive VP, Steve Reitmeister, knows when key trades are about to be triggered and which of our experts has the hottest hand. Click to see them now>>
HONDA MOTOR (HMC): Free Stock Analysis Report
GENTEX CORP (GNTX): Free Stock Analysis Report
SPARTAN MOTORS (SPAR): Free Stock Analysis Report
STANDARD MOTOR (SMP): Free Stock Analysis Report
Original post