
We have issued an updated research report on Kennametal Inc. (NYSE:KMT) on Jun 10.
The industrial tool maker, with a market capitalization of $2.7 billion, currently carries a Zacks Rank #3 (Hold).
Certain growth drivers and headwinds that might influence Kennametal have been discussed below.
Factors Favoring the Company
Tactical Initiatives: Kennametal has undertaken three initiatives — growth, modernization and simplification — to boost its performance. Its growth initiative has helped in improving operational efficiency and lowering costs while the modernization drive (currently in progress) is contributing to strong operating leverage. The simplification move helped in improving operational efficiency and reducing costs.
It is worth mentioning here that these three initiatives boosted Kennametal’s bottom line by 11 cents in the third quarter of fiscal 2019. This contribution was higher than 10 cents recorded in the previous quarter.
To add, the company anticipates the second phase of the simplification/modernization initiatives to yield annualized savings of $35-$40 million by fiscal 2020 (ending June 2020).
Diversification Benefits: Kennametal — through its three segments namely Industrial, WIDIA and Infrastructure — caters to the needs of a vast customer base in multiple end markets. Prime markets served are automotive, machine tool, farm machinery, highway construction, coal mining, quarrying, oil and gas exploration, and aerospace.
We believe such diversification has been proving beneficial for the company over time.
Bottom-Line Projections: Kennametal recorded 10% year-over-year growth in earnings per share in the third quarter of fiscal 2019 (ended Mar 31, 2019). The results primarily benefited from its tactical initiatives (explained below) and favorable price realization.
For fiscal 2019 (ending June 2019), the company anticipates adjusted earnings per share of $3.00-$3.10, higher than $2.65 recorded in fiscal 2018 (ended June 2018).
Factors Working Against Kennametal
Share Price Performance, Earnings Estimates: In the third quarter of fiscal 2019, the company delivered weaker-than-expected results, with earnings lagging estimates by 3.75%.
It is worth mentioning here that Kennametal’s share price has declined roughly 10.5% in the past six months and decreased 18.9% since the release of the latest results on May 6. This compares unfavorably with the industry’s growth of 9.2% in the past six months and a fall of 6.7% since May 6.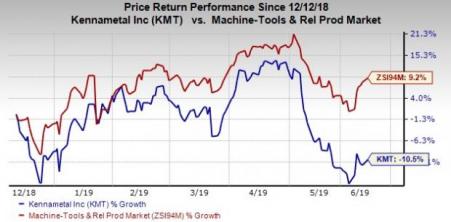
Moreover, earnings estimates for the company have been lowered in the past 60 days. Currently, the Zacks Consensus Estimate for earnings of $3.06 for fiscal 2019 and $3.36 for fiscal 2020 reflects decline of 2.2% and 3.7%, respectively.
Kennametal Inc. Price and Consensus
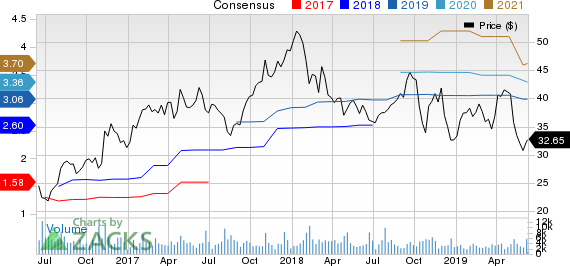
Kennametal Inc. price-consensus-chart | Kennametal Inc. Quote
Top-Line Weakness: In the third quarter of fiscal 2019, Kennametal’s sales lagged estimates by 4% while declined 1.8% year over year. Weakness in Industrial and WIDIA segments, negative impact of business days, and forex woes adversely impacted results.
For fiscal 2019, the company predicts organic sales to grow 5%, at the lower end of the previously mentioned 5-8% and below organic growth of 12% recorded in fiscal 2018.
Costs and Forex Woes: High raw material costs due to tariffs, lower absorption of costs and forex woes adversely impacted margins in the third quarter of fiscal 2019. It is worth mentioning here that foreign currency translation lowered revenues by 4% and hurt earnings by 4 cents per share in the reported quarter.
For fiscal 2019, the company believes that rising raw material costs, resulting from tariffs, will be concerning. It also believes that its pricing actions will bring in some relief. Also, any rise in financial obligations due to highly leveraged balance sheet, metric being at $592 million at the end of the third fiscal quarter, will be an issue to look after.
Stocks to Consider
Some better-ranked stocks in the Zacks Industrial Products sector are Chart Industries, Inc. (NASDAQ:GTLS) , DXP Enterprises, Inc. (NASDAQ:DXPE) and Dover Corporation (NYSE:DOV) . While Chart Industries currently sports a Zacks Rank #1 (Strong Buy), DXP Enterprises and Dover carry a Zacks Rank #2 (Buy). You can see the complete list of today’s Zacks #1 Rank stocks here.
In the past 60 days, earnings estimates for all these three stocks have improved for the current year. Further, average earnings surprise for the last four quarters was positive 16.56% for Chart Industries, 48.47% for DXP Enterprises and 8.61% for Dover.
Will you retire a millionaire?
One out of every six people retires a multimillionaire. Get smart tips you can do today to become one of them in a new Special Report, “7 Things You Can Do Now to Retire a Multimillionaire.”
Click to get it free >>
Kennametal Inc. (KMT): Free Stock Analysis Report
Dover Corporation (DOV): Free Stock Analysis Report
Chart Industries, Inc. (GTLS): Free Stock Analysis Report
DXP Enterprises, Inc. (DXPE): Free Stock Analysis Report
Original post
Zacks Investment Research