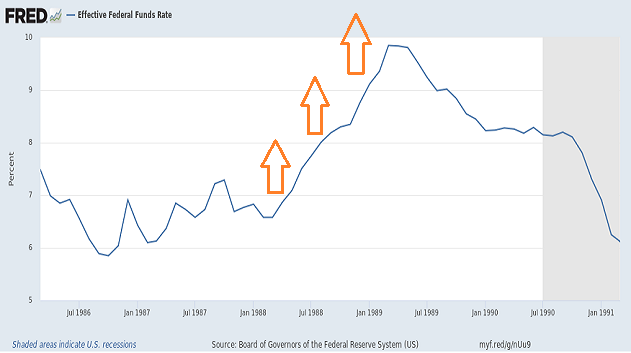
Each of the last three recessions contained elements of extraordinary financial instability. For example, Savings & Loan (S&L) institutions used federally insured deposits to make reckless real estate loans in the 1980s. When the Federal Reserve raised its overnight lending rate more than 300 basis points between March 1988 and March 1989, a real estate bubble burst, hundreds upon hundreds of S&L’s fell apart, and the 1990-1991 recession damaged livelihoods.
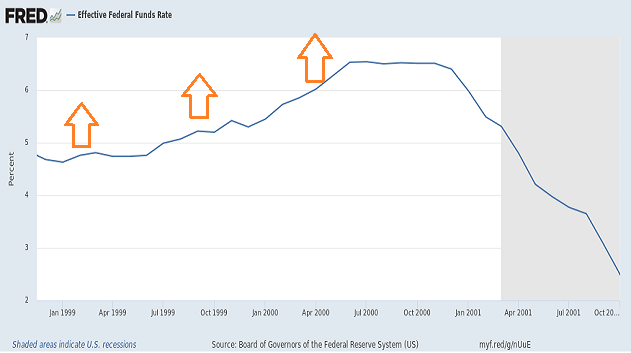
Not surprisingly, one finds comparable patterns of financial senselessness in the late 1990s and again in the mid-2000s. Never-before levels of margin debt had been employed in the late 1990s to participate in dot-com mania. When the Greenspan Fed raised interest rates 200 basis points to contain the stock market’s “irrational exuberance,” the Internet bubble popped, millions of tech workers lost their jobs, and the 2001 recession hindered economic well-being.
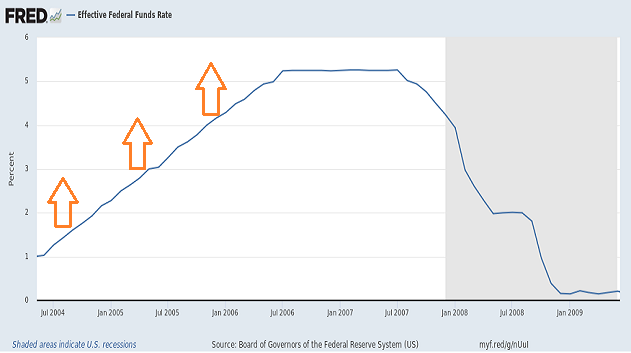
Were things really any different by the time we arrived at the housing bubble’s bursting? Banks heedlessly served up subprime loans to nearly anyone with a pulse and a pen. When the Federal Reserve raised its overnight lending rate more than 400 basis points between the summer of 2004 and the summer of 2006, the residential housing balloon exploded, the subprime catastrophe worsened, and the Great Recession slammed hundreds of millions of Americans.
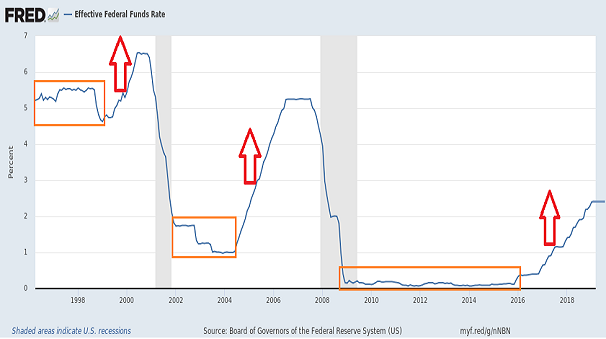
It is easy to see why so many people want the Fed to refrain from raising rates ever again. Whenever the Fed has embarked on a rate hiking campaign in the recent past, bad events have followed.
What scores of easy money cheerleaders ignore, however, is the real reason behind the scenes of the disastrous outcomes. Specifically, the Fed’s manipulation of lower rates for extended periods inflates stock, bond and real estate values, fostering a wealth effect. Yet that same wealth effect is subject to monstrous reversal when hyper-inflated asset bubbles rupture.
Maybe the financial system is much stronger this time around? Or maybe the Fed has learned its lesson from past mistakes and will act much faster to curtail an unwinding of the “wealth effect.”
However, there’s a problem with the assumption that the Federal Reserve will be successful in saving stocks, bonds and real estate going forward. Specifically, the credit cycle itself is in jeopardy.
Consider a substantial area of vulnerability: leveraged loans. In the Federal Reserve’s own Financial Stability report, the central bank called out the $1 trillion market and its declining credit standards. Indeed, it would seem to be a larger problem than the $650 billion in “subprime.”
Put another way, the risky area of corporate debt has doubled since 2010. Similarly, the number of companies requiring these loans (1000-plus) has surged 56% since 2010.
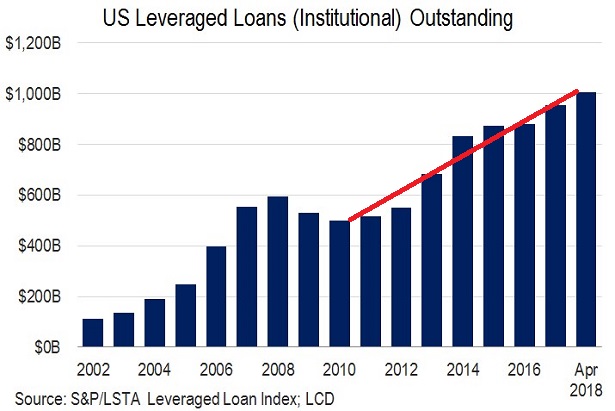
On a global scale, floating rate loans to companies with bad credit and high debt-to-earnings ratios have reached $1.3 trillion. Not only is that twice the leveraged loan market from last decade, it is twice the size of the “subprime” peak.
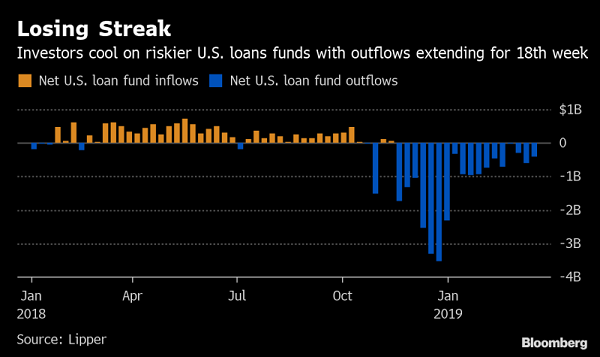
There’s also the issue of investors throwing in the towel. It may not be an exodus at this juncture, but the trend has been less than friendly.
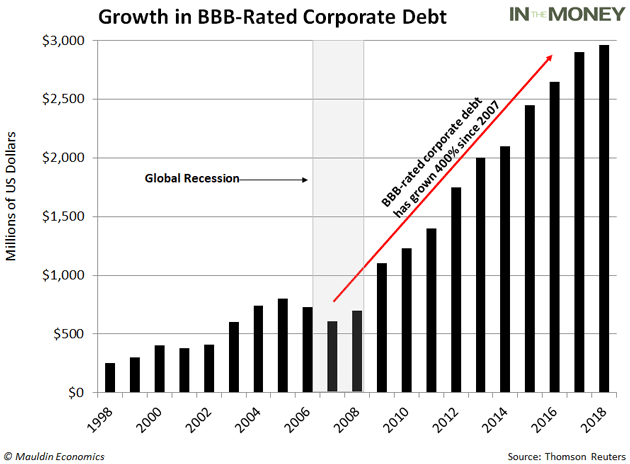
An equally challenging circumstance? The proliferation of BBB-rated investment grade debt. In fact, in a market of $6 trillion-plus, nearly 50% of the debt rests at the lowest possible rating (BBB) to be considered “investment grade.” Just one notch above “junk.”
The concern is that a tidal wave of downgrades from “investment grade” to “junk” would make it far more expensive for those companies to raise money. They might be forced to dilute their stock shares by issuing stock to shore up balance sheets. Or cut dividends. Indeed, any action to reduce debt and to improve or maintain a rating would likely hurt corporate stock performance.
Surely, households are doing well, right? Employment data show that employees are working. Consumer data show that people are consuming.
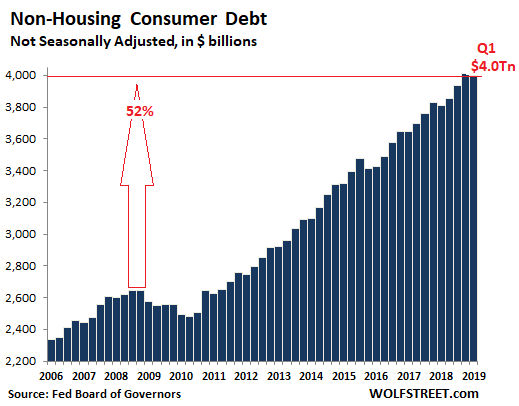
An issue at the household level? People are spending money that they do not have. Non-housing consumer debt, which includes revolving credit, auto loans and student loans, has soared more than 50% since the Great Recession.
Is $4 trillion really something to sneeze at? We are talking about $4 trillion in non-mortgage interest and principal that goes on for an indefinite length of time – obligations that would become particularly challenging if a recession knocked these folks out of the employment seat.
Granted, the mainstream media are going to focus on the topsy-turvy world of tariffs and trade. They cannot ignore 700-point intra-day sell-offs on a Monday in May, can they?
What they are missing, though, is the notion that the China-U.S. trade dispute is not the reason for the recession that people may fear. The trade war might be (or might not be) the catalyst, or the pin, that pricks the “Everything Bubble” already in existence. Indeed, it is the severity of a “wealth effect reversal” that will cause the next recession.
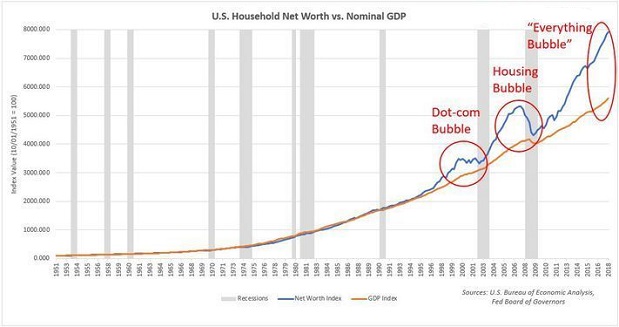
Should the trade war get out of hand, many will be calling for the Fed to slash interest rates. And it’s not like market cheerleaders aren’t already lobbying for the Fed to backstop any additional financial market declines.
As I emphasized in The Attractiveness of a Defensive Stock Strategy and Why Modest Risk-Renting Will Outshine Extreme Risk-Taking, there are more attractive risk-reward paths than blind faith in 100% equity allocations. I’ve talked about my preference for low volatility in ETFs like Invesco S&P Mid Cap Low Volatility (XMLV). I’ve discussed the ways that non-cyclical sectors like Consumer Staples Select Sector SPDR (XLP) and Utilities Select Sector SPDR (XLU) would be worthy on a relative basis, while recognizing the high valuations.
Some of my best producers continue to be in the hybrid camp. Higher quality preferred stock like Duke Energy (NYSE:DUK) (DUKH) 5.125% Junior Subordinated comes to mind. ETF fans should look into VanEck Vectors Preferred Securities ex Financials (PFXF).
Finally, I continue to favor 2.35%-2.55% cash instruments for a portion of client portfolios. Simply stated, you cannot buy “cheap stuff” or bargains if you don’t have the cash on hand when you need to pull the trigger. And sometimes, that means you need to sell some of the ridiculously valued “expensive stuff.”
Disclosure Statement: ETF Expert is a web log (“blog”) that makes the world of ETFs easier to understand. Gary Gordon, MS, CFP is the president of Pacific Park Financial, Inc., a Registered Investment Adviser with the SEC. Gary Gordon, Pacific Park Financial, Inc., and/or its clients may hold positions in the ETFs, mutual funds, and/or any investment asset mentioned above. The commentary does not constitute individualized investment advice. The opinions offered herein are not personalized recommendations to buy, sell or hold securities. At times, issuers of exchange-traded products compensate Pacific Park Financial, Inc. or its subsidiaries for advertising at the ETF Expert website. ETF Expert content is created independently of any advertising relationship.
