The price of Bitcoin is declining at an unprecedented speed. Less than a month ago, BTC/USD was hovering above $5500. Last week it fell to as low as $3210, prompting Peter Mallouk, chief investment officer at Creative Planning Inc., to call Bitcoin a “dead man walking”.
However, the truth is it didn’t take a professional money manager to recognize the fact that Bitcoin was extremely vulnerable. We have been calling it a bubble for over a year and now even “hodlers” are starting to abandon crypto.
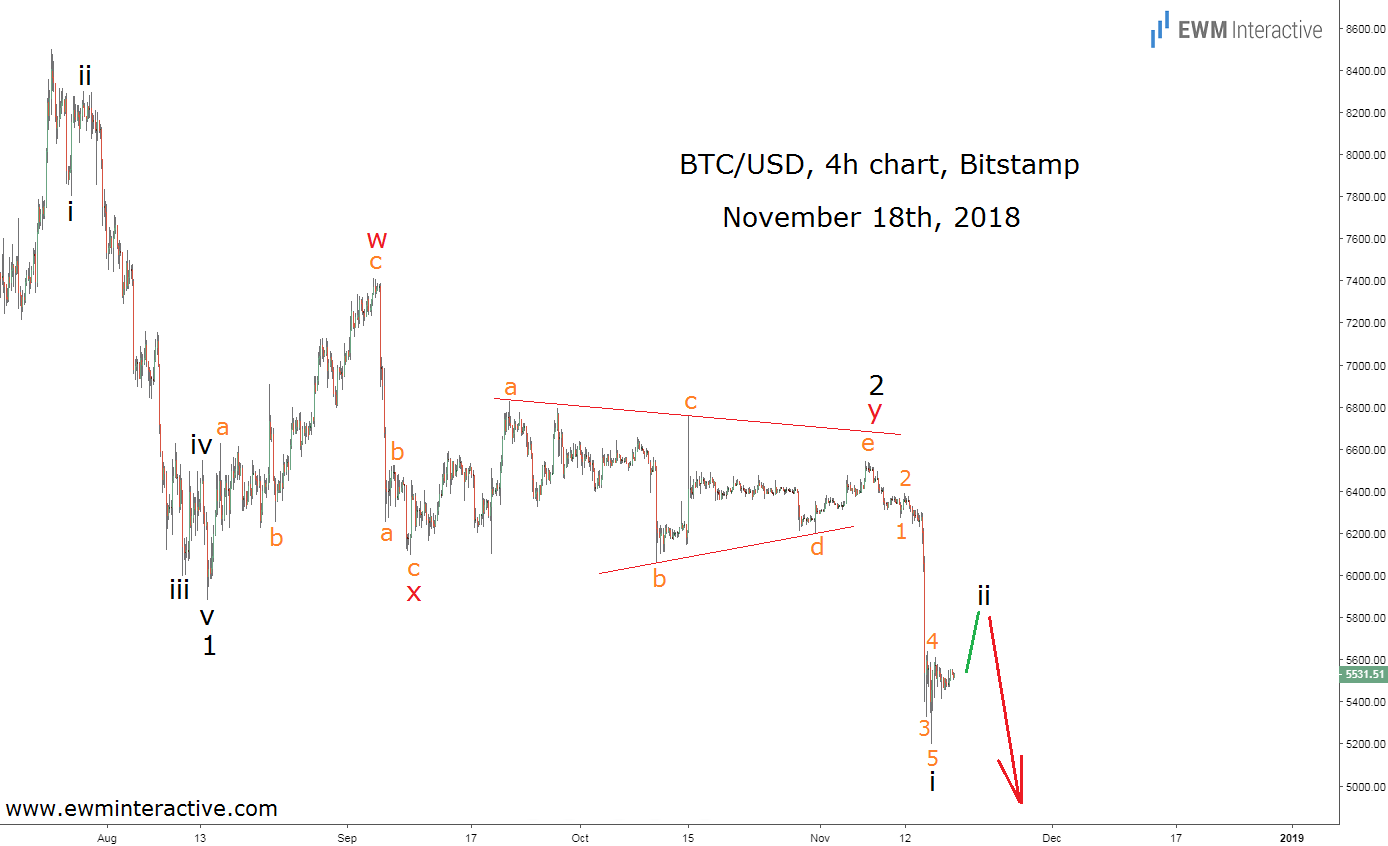
An indeed, Bitcoin has been regularly giving us reasons for pessimism. The chart below, for example, was sent to our subscribers on November 18th. It shows how the Elliott Wave Principle put traders ahead of the crash once again.
This negative outlook actually derived from a previous bearish idea. The bigger picture remained unchanged so it made sense to simply keep shorting BTC/USD. While it was possible for wave ii to lift the pair a little higher, the anticipated wave iii down was what we were really looking forward to. Fortunately, we did not have to wait too long for it. Just a week later, BTC/USD was down to $3475.

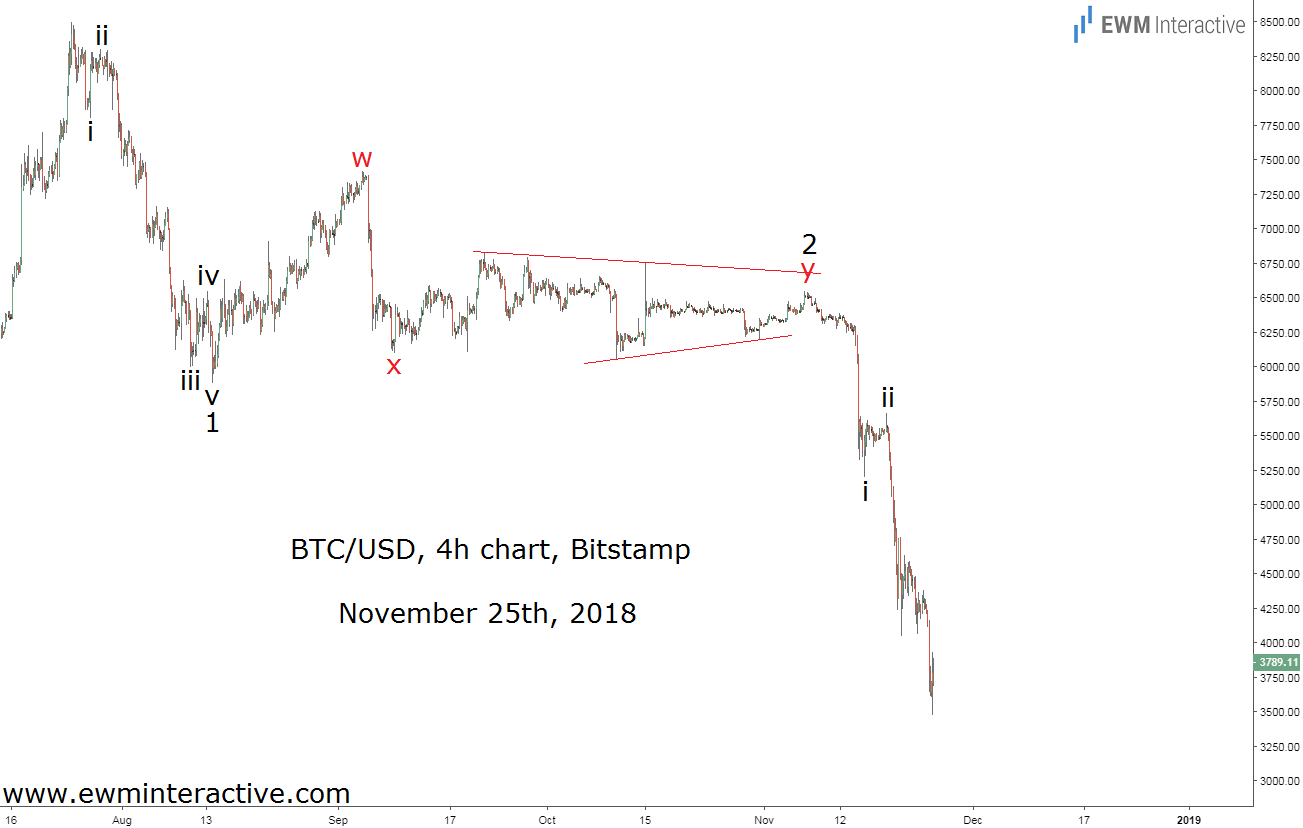
So far so good, but even the strongest trend is sometimes interrupted by a correction in the opposite direction. Following a decline of over 36% in only a week, it was time to take a closer look and see if a short-term recovery should be expected. The chart below, sent to clients on November 25th, gave an affirmative answer.

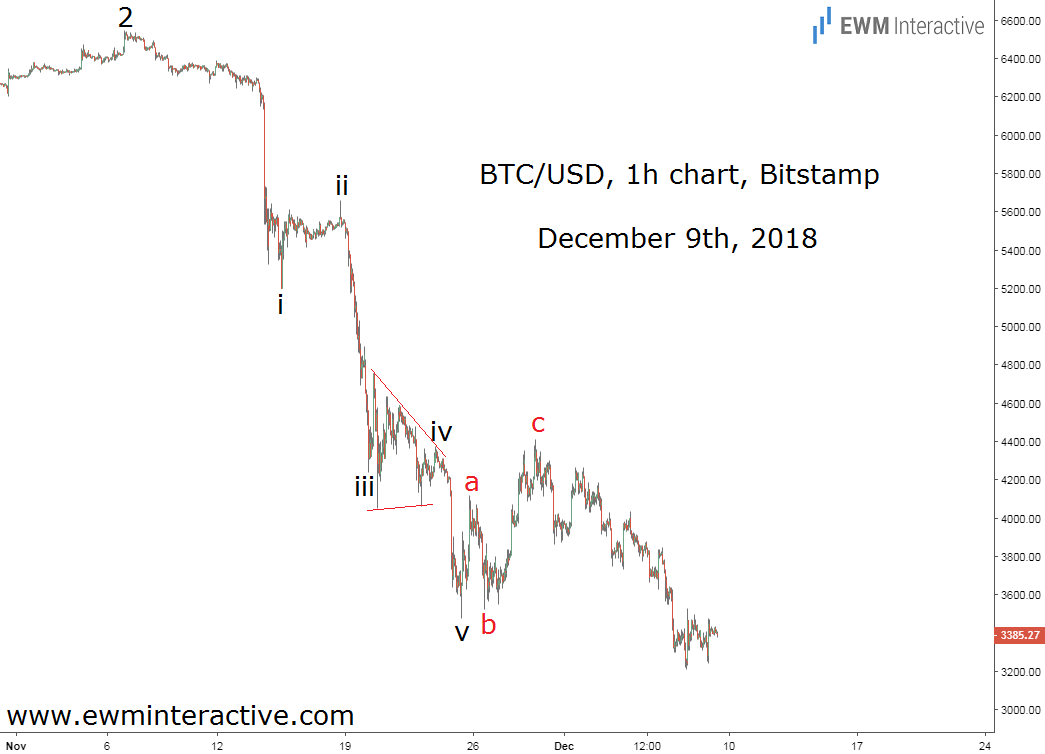
Bitcoin’s hourly chart revealed that the structure of the plunge between $6544 and $3475 was impulsive. According to the theory, before the larger trend resumes, every impulse is followed by a three-wave correction in the opposite direction. Hence, we assumed a three-wave recovery can be expected, before the bears return. In that sense, what happened next was hardly a surprise.
The price of Bitcoin climbed to $4410 on November 29th and some experts even hurried to recognize this recovery as the start of the next bull market. Elliott Wave analysts, of course, knew not to trust it. Less than ten days later, BTC/USD fell to a new low of $3210 on December 7th, bringing its total year-to-date loss to 83.7%.
The SEC’s continued unwillingness to approve a Bitcoin ETF, recent lawsuits against crypto promoters and miners going out of business have certainly contributed to the sharp drop in BTC/USD. In our opinion, however, the real reason for it was the Elliott wave structure and the fact that market psychology took a turn for the worse.
