Earnings per share (EPS) for the S&P 500 for Q2 came in at $87. Those results are no better than the EPS data from four years earlier. Worse yet, the $87 GAAP-based earnings are 18% lower than the $106 reached in Q3 of 2014.
Now look at the price-to-earnings (P/E) ratio chart below. For the better part of three years (circa 2013 -2016), the traditional metric held relatively stable between 18x-21x previous 12 months earnings.
Since the start of 2015 roughly 20 months ago, however, P/Es have literally catapulted up to 25.2. As far as putting the much-maligned valuation tool into perspective, a TTM P/E of 25.2 is higher than approximately 90% of previous bull market tops. Ouch!
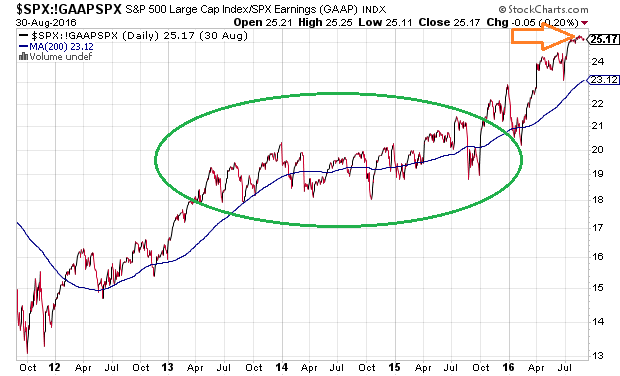
It is important to note that this is NOT a chart of stock market growth. The S&P 500 has climbed a modest 6% since the start of 2015. The price-to-earnings ratio? About 25%.
In other words, stock prices have been rising ever so timidly (6% over 20 months) in spite of the precipitous deterioration of profits across aggregate S&P 500 data.
Many optimists have tried (in vein) to push the notion that there are other measures that indicate a fairly valued equity environment. A dividend yield that is higher than the 10-year treasury, for example.
The dividend yield from corporations was higher than the 10-year treasury for the bulk of the low rate environment after the Great Depression (1936-1955). That alone did little to arrest four harsh bears from occurring in 1937-1938 (-49.1%), 1938-1939 (-23.3%), 1939-1942 (-40.4%), and 1946-1947 (-23.2%).
In truth, it does not matter what methodology one prefers – price-to-sales, price-to-book, price-to-cash flow, EV/EBITDA, Tobin’s Q, median forward P/E, market-cap-to-GDP, household equity – extraordinary overvaluation is the reality.
The real questions are: (1) How long will corporate stock buybacks support equity prices and (2) How long will central bank manipulation support asset prices.
With respect to the first question, data already shows a drop-off in share buybacks over recent quarters. For instance, the announcement of new purchases has slumped $115 billion to date.
The team at Barclays noted that gross buybacks by S&P 500 corporations declined 15% in Q2. Even more troubling perhaps? The 3rd quarter (July-September) appears to be worse off than Q2 or Q1 or the prior 3rd quarter.
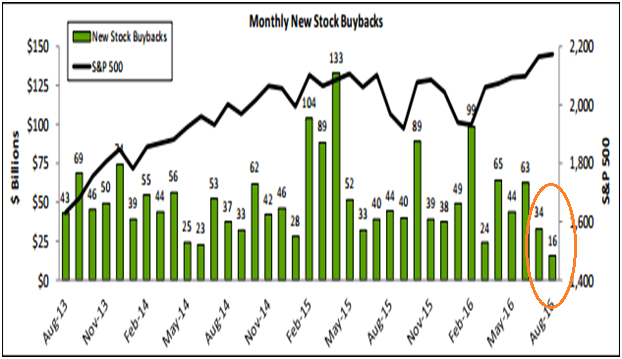
Alright, then. Stock buybacks may or may not be slowing. Yet the central banks? They’ve remained as accommodating as ever. Still, history demonstrates that faith in central bank intervention can erode and that monetary policies could not prevent bearish stock price deflation.
To delineate, let’s step back in a Federal Reserve time machine. The Fed lowered its overnight lending rate 500 basis points (five percentage points) from 8% to 3% to stimulate economic activity in the 1990s. It did not prevent a recession; it did not prevent the 21% price depreciation in equities.
The Fed dropped overnight lending rate 500 basis points (five percentage points) from approximately 6% to 1% to stimulate economic activity in the early 2000s. It did not head off the economic contraction or the dot-com collapse or the 80% price evisceration on the Nasdaq.
It did not keep the S&P 500 from losing 50% over an agonizing two-year, nine month period either. (Note: The 50-year lows for easy-to-qualify residential mortgages alongside a Fed that kept overnight rates far too low for far too long contributed handsomely to the real estate bubble.)
Are you beginning to see the pattern? The Federal Reserve next lowered its Fed Funds rate 500 basis points (five percentage points) from the 5% level to 0% at an attempt to escape the Great Recession in 2008-09. It was not enough.
They employed electronic money credit creation via QE1, QE2, Operation Twist and QE3, swelling their balance sheet from $800 billion to $4.5 trillion. And the Fed Funds overnight lending rate? It remained at 0% (0%-0.25%) until December of 2015, where it was raised a paltry 0.25% (0.25%-0.50%). And, of course, the S&P 500 logged -57% from the high-to-the-low in the financial crisis.
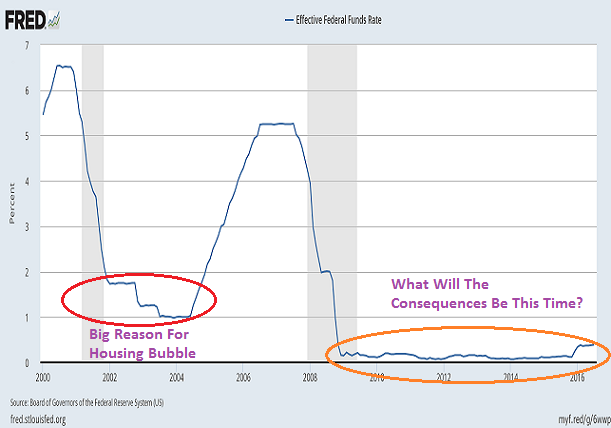
Does anyone have any doubt that the Fed will need to go back to QE4 to manage the next economic downturn? Or even negative rate policy like the foolish folks at central banks in Europe and in Japan?
Even though 500 basis point (five percentage point) reductions will never be in play again, monetary policy stimulus and federal government stimulus will still need to be deployed to ease the pain when the cyclical shift arrives.
Unfortunately, the gamesmanship is not one that can continue indefinitely. For one thing, central bank acquisition of assets destroys liquidity for the markets of the assets that have been targeted for acquisition.
We’ve already seen unprecedented levels of volatility in bonds around the globe because central banks own an ungodly percentage of them; liquidity has evaporated. Meanwhile, Japan is well on its way to owning far too much of its stock market.
Keep in mind, all of these monetary policy accommodations – quantitative easing (QE), zero percent rate policy (ZIRP), negative interest rate policy (NIRP) – were supposed to stimulate economic activity.
Supposedly, when central banks are easing as opposed to tightening, money that flows into stocks and bonds should create a wealth effect that eventually makes its way down into the real economy. Yet one should question, is this even happening anymore?
The economy has grown at a lackluster 1% for three consecutive quarters; it is not even able to get close to the sub-par growth of 2% that has represented the “new normal” throughout the current economic recovery. Worse yet, world trade (adjusted or unadjusted data) have been trending lower since the Federal Reserve ended its third iteration of QE back on December 18, 2014.
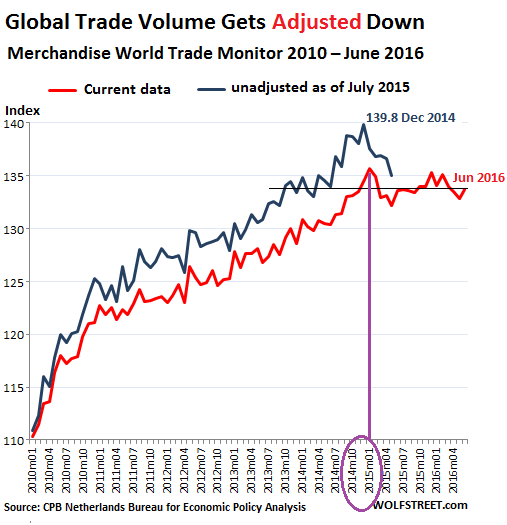
Of course, those who choose to focus on signs of economic well-being typically talk about the housing market and the job market. What they neglect to mention, however, is that year-over-year home sales was negative in July (-1.6%), while year-over-year labor growth peaked in February of 2015. It has been diminishing ever since.
Is everything really awesome, then? Probably not. The unimaginable flattening of the yield curve (30s-2s) tell most market watchers that things are very far from copacetic.
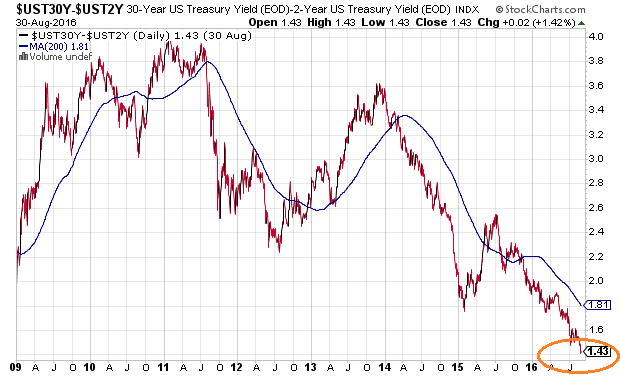
I am not here to tell anyone that they should refrain from chasing performance entirely. If someone is inclined to believe that there are no alternatives to equities – if someone believes he/she will stand firm with a larger-than-life allocation to stocks (and bonds) – I will not stand in anyone’s way.
On the other hand, one should be mindful of the evidence that has led Stanley Druckenmiller, George Soros, Jim Rogers, Carl Icahn, Jim Grant, Bill Gross, Jeffrey Gundlach and scores of extremely successful investors to warn about a significant asset sell-off.
The diminutive reward prospects relative to the real risk of financial loss should at least make an investor consider scaling back from his/her typical asset allocation target.
Disclosure: Gary Gordon, MS, CFP is the president of Pacific Park Financial, Inc., a Registered Investment Adviser with the SEC. Gary Gordon, Pacific Park Financial, Inc, and/or its clients June hold positions in the ETFs, mutual funds, and/or any investment asset mentioned above. The commentary does not constitute individualized investment advice. The opinions offered herein are not personalized recommendations to buy, sell or hold securities. At times, issuers of exchange-traded products compensate Pacific Park Financial, Inc. or its subsidiaries for advertising at the ETF Expert web site. ETF Expert content is created independently of any advertising relationships.
