
In times like these it is very important to understand the message of price, and the value of charts as an extremely efficient short-hand means for communicating broad-based fundamental assessments.
But first a quick (or maybe not so quick) aside: There is a false dichotomy between ‘fundamental’ trading on one side and ‘technical’ trading on the other.
The competing perspectives at the poles are so extreme, “fundamentals vs technicals” is practically a theological debate.
We reject this artificial separation of fundamentals and technicals.
In fact we argue that, with a sufficiently nuanced perspective, there is no clear demarcation between the two. The visual picture of the charts, and the mathematical and anecdotal points of fundamental data, are just different forms of situational analysis.
And because the chart represents the collective votes of all market participants — on a size weighted basis, with the biggest participants getting the most ‘votes’ — it is hard to say where one stops (technicals) and the other (fundamentals) begins.
Traders and investors alike get hung up on the supposed predictive power of their models. The technical participant falls into this trap by supposing charts predict the future; the fundamental participant equally errs by assuming his data models — belief about what value ‘should’ be — are incontrovertible claims on reality.
The answer to this problem can be found in the old zen koan, “the finger pointing at the moon is not the moon.”
Whether considering the abstract input of a pattern on a chart, or the abstract mathematical data point of, say, USDA crop estimates or a company’s enterprise value to EBITDA ratio, it is good to remember ‘the map is not the territory’ and that models are not reality. We work with approximations and heuristics — sophisticated rules of thumb — for the sake of efficiency in a complex world.
As such, the need for “certainty” should be taken with a grain of salt (or perhaps a whole shaker). As with bluff-raising a poker hand, or approaching an attractive stranger In a bar, the game is all about odds, probabilities, and situational dynamics.
(This leads to one embedded advantage for chart-oriented traders over pure fundamental investors: More accessible risk management protocols. For the chart-oriented trader, if price violates his logically placed stop, he is out; for the pure fundamental investor, a sharp countermove only increases the hypothetical fundamental value, and may spur an urge to “double down” on the position.)
The pure fundamentalist may argue that chart patterns lie and deceive — but so too can numbers. As Mark Twain (via Benjamin Disraeli) liked to say, “there are lies, damn lies, and statistics.”
The further challenge with fundamentals is that, as Gary Bielfeldt once noted, you are lucky if you have 70% of the puzzle pieces – and those who hold the remaining 30%, via their nature as informed insiders, leave footprints in the form of price action.
It is an irony that, even as the lament goes up that charts have become schizophrenic, we find the communicative value of the charts – on a macro level – to be higher than ever.
Of course, from a fundamental perspective, we invest time and energy into developing a view of what is happening – and the various scenario trees – for Europe, China and the United States.
But we are very aware there is a cap on how useful this understanding can be, when the present drivers are so intensely political. How do you game what a frenzied flock of economically illiterate politicians are going to do?
Europe is balanced on a knife edge. The Greek election results don’t change that, unless Raoul Pal’s ‘end game‘ plays out, in which case the change entails a fiscal armageddon scenario.
China, too, is balanced on a knife edge of potential hard landing (vs trillions in reserves). And the United States is either 1) recovering slowly but surely, or 2) slipping back into recession, with very astute observers falling on both sides of the debate.
It is truly a blender environment. As such, it is a great comfort and utility to us as traders to be able to focus on what we NEED to know, as opposed to what we would LIKE to know, or worse, wasting precious energy attempting to suss out what it is IMPOSSIBLE to know.
When a situation falls in Charlie Munger’s “too hard bucket” — a highly useful meme to be explored in future — only a modest amount of elbow grease to get a handle on the situation is required.
Consider the following hypothetical scenario:
You have inherited a piece of property from a distant relative. You are inspecting the property for the first time. In the backyard shed, on a very hot day, you come across a dilapidated crate of old dynamite. The dynamite sticks, bundled together with twine, are covered in a quarter inch of dust. They haven’t been touched in years — perhaps decades? — and appear to be sweating nitroglycerine.
Here is the question: How much due diligence is required in deciding what to do next?
Do you need to oh-so-carefully take samples of the dust, to determine the ratio of explosive particle content?
Do you need to visit the county examiner’s office for a historical record of munitions companies in the area, to see where the dynamite may have originated?
Do you need to do a detailed web search on the destabilizing effects of heat and age on poorly stored explosives?
Or, do you simply 1) back the hell out of the shed, 2) call a bomb squad, and 3) stay away until someone takes care of it?
The dynamite-in-the-shed metaphor is our way of poking fun at those who choose to “deep dive” into the Europe situation when the clear signaling of front-and-center risk is enough. Without a lot of web searching effort, you can find exhaustive analyses of Target 2 and ELAs and LTROs and blah blah excruciating minutia blah. But what is the point, when a basic risk:reward assessment — and the possibility of a political explosion at any moment — tells you what you need to know?
Sometimes, a broad level macro understanding — informed by the message of price — is more than enough to say “stay away.” Nassim Taleb put it nicely in an excerpt from his upcoming book, Antifragile:
Just as we are not likely to mistake a bear for a stone (but likely to mistake a stone for a bear), it is almost impossible for someone rational with a clear, uninfected mind, one who is not drowning in data, to mistake a vital signal, one that matters for his survival, for noise. Significant signals have a way to reach you.
For us the “significant signals” are contained in price action, i.e. charts. Fundamental legwork is like drilling for oil: The charts tell you where to drill… and how deep… and which drilling sites should be capped, expanded, or abandoned.
With the above in mind, let’s take a look at some charts — circa June 19th, 2012 — to see what they are saying (click to enlarge): 


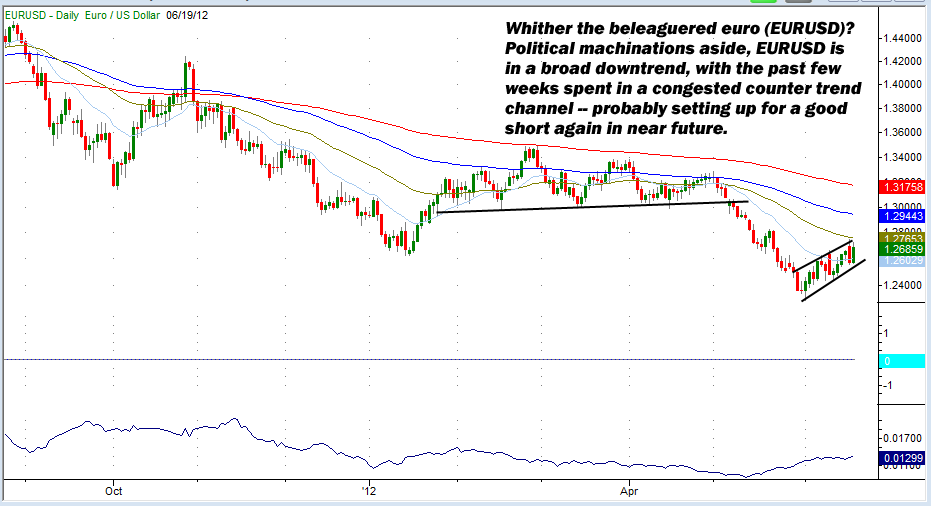 EUR/USD" title="EUR/USD" width="931" height="506">
Here's to charting a profitable course.
Disclosure: This content is general info only, not to be taken as investment advice. Click here for disclaimer
- English (UK)
- English (India)
- English (Canada)
- English (Australia)
- English (South Africa)
- English (Philippines)
- English (Nigeria)
- Deutsch
- Español (España)
- Español (México)
- Français
- Italiano
- Nederlands
- Português (Portugal)
- Polski
- Português (Brasil)
- Русский
- Türkçe
- العربية
- Ελληνικά
- Svenska
- Suomi
- עברית
- 日本語
- 한국어
- 简体中文
- 繁體中文
- Bahasa Indonesia
- Bahasa Melayu
- ไทย
- Tiếng Việt
- हिंदी
Here's Why Technical Charts Matter More Than Ever
Published 06/20/2012, 01:08 AM
Updated 07/09/2023, 06:31 AM
Here's Why Technical Charts Matter More Than Ever
3rd party Ad. Not an offer or recommendation by Investing.com. See disclosure here or
remove ads
.
Latest comments
Install Our App
Risk Disclosure: Trading in financial instruments and/or cryptocurrencies involves high risks including the risk of losing some, or all, of your investment amount, and may not be suitable for all investors. Prices of cryptocurrencies are extremely volatile and may be affected by external factors such as financial, regulatory or political events. Trading on margin increases the financial risks.
Before deciding to trade in financial instrument or cryptocurrencies you should be fully informed of the risks and costs associated with trading the financial markets, carefully consider your investment objectives, level of experience, and risk appetite, and seek professional advice where needed.
Fusion Media would like to remind you that the data contained in this website is not necessarily real-time nor accurate. The data and prices on the website are not necessarily provided by any market or exchange, but may be provided by market makers, and so prices may not be accurate and may differ from the actual price at any given market, meaning prices are indicative and not appropriate for trading purposes. Fusion Media and any provider of the data contained in this website will not accept liability for any loss or damage as a result of your trading, or your reliance on the information contained within this website.
It is prohibited to use, store, reproduce, display, modify, transmit or distribute the data contained in this website without the explicit prior written permission of Fusion Media and/or the data provider. All intellectual property rights are reserved by the providers and/or the exchange providing the data contained in this website.
Fusion Media may be compensated by the advertisers that appear on the website, based on your interaction with the advertisements or advertisers.
© 2007-2024 - Fusion Media Limited. All Rights Reserved.