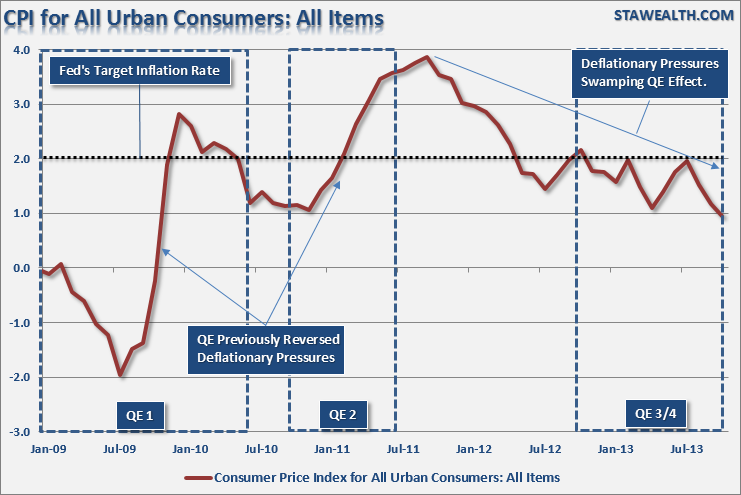
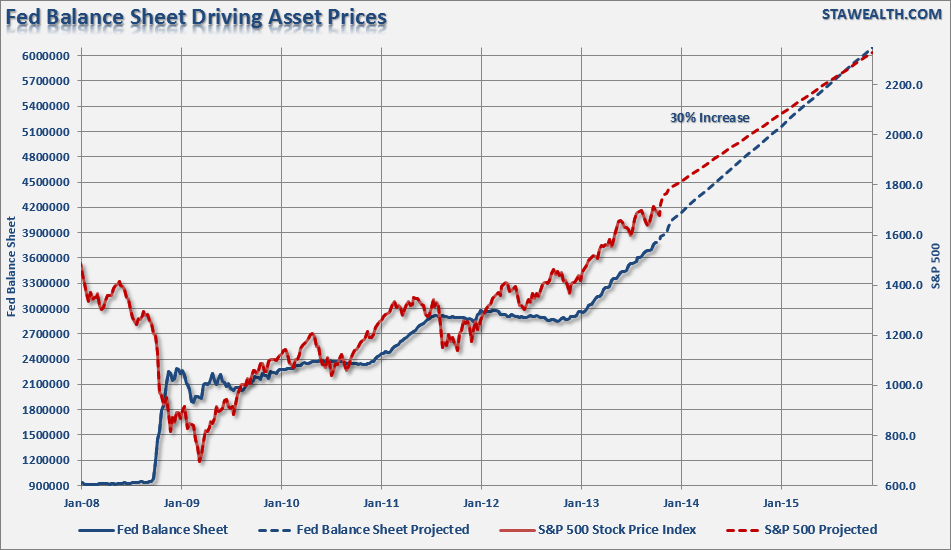
In yesterday's post, I discussed why I agreed with Jeremy Grantham's recent prognostication that stocks could rise another 30% from current levels. That agreement was not from some fundamental valuation story, as there is not one currently, but from the standpoint that a continuation of the current monetary programs by the Federal Reserve will continue to boost asset prices higher. As I stated, while there is much talk about the Federal Reserve potentially "tapering" its purchases as early as 2014, the rising wave of deflationary pressures, both domestic and abroad, will likely keep the Federal Reserve engaged longer than currently believed.
While this chart is likely to excite the "bulls," it also brings two very fundamental issues into question. The first is valuations. The chart below extrapolates valuations based on forward reported earnings estimates. Barring any exogenous shock, and assuming that current reported earnings estimates actually occur, the S&P 500 will be sporting a P/E ratio of 21.17x in 2015.
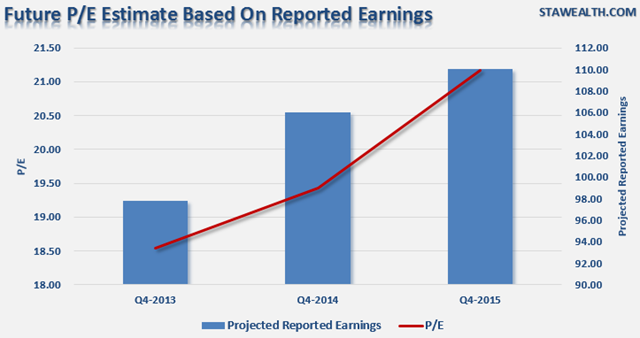
However, if earnings growth stagnates then valuation multiples will rise dramatically from current levels. The further that multiples deviate from the long term mean the greater the eventual reversion will be.
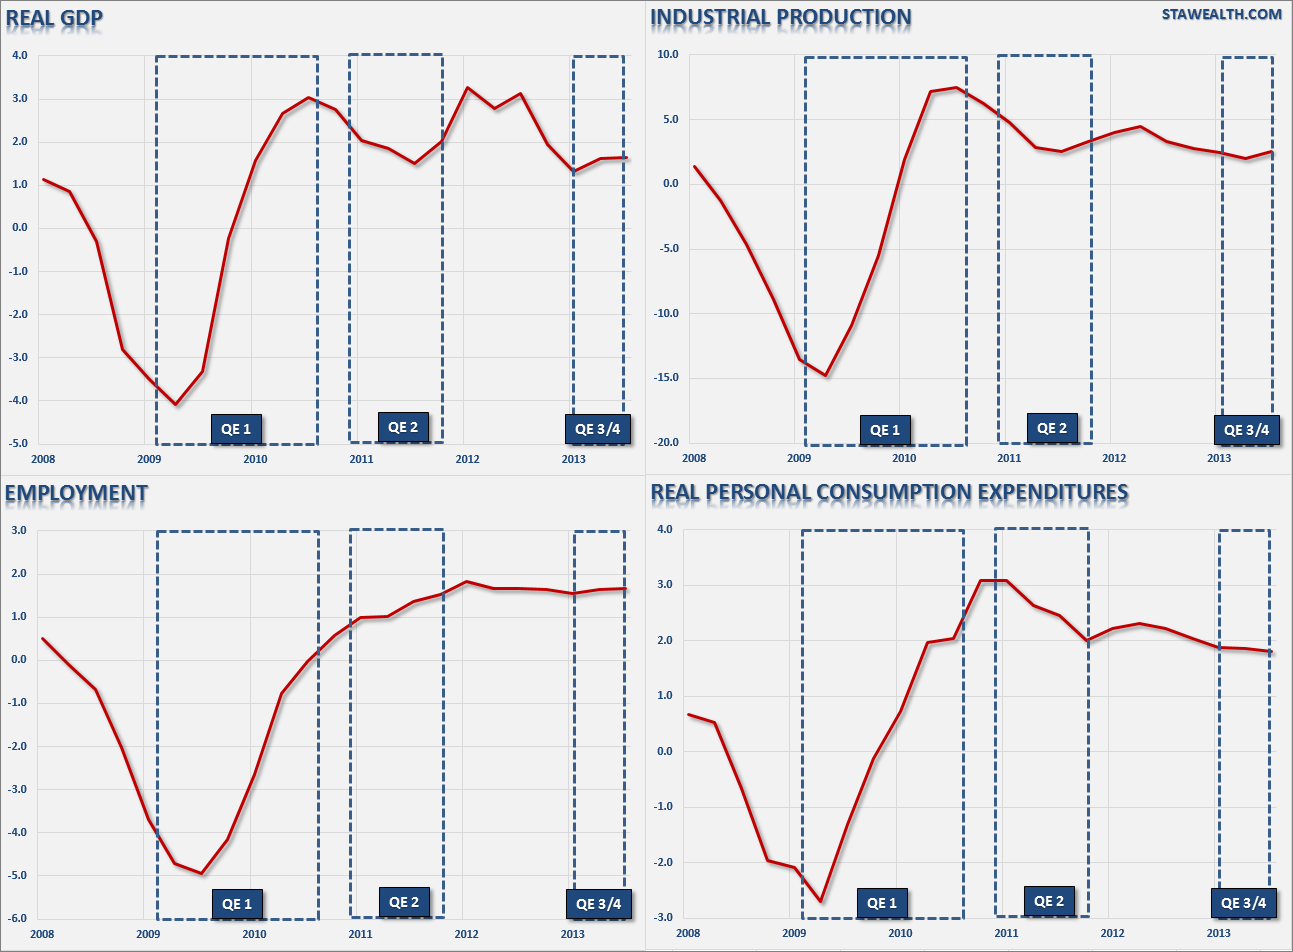
The second, and ostensibly the much more important point, is the effect of the Federal Reserve's ongoing monetary interventions into the economy. While there is evidence that the initial round of QE, which was combined with myriad of other Government related bailouts and inducements, did indeed spur some early economic recovery post the financial crisis. However, subsequent rounds of interventions have had a more muted effect on overall economic activity. The 4-panel chart below shows the QE programs overlaid against the primary drivers of the economy.
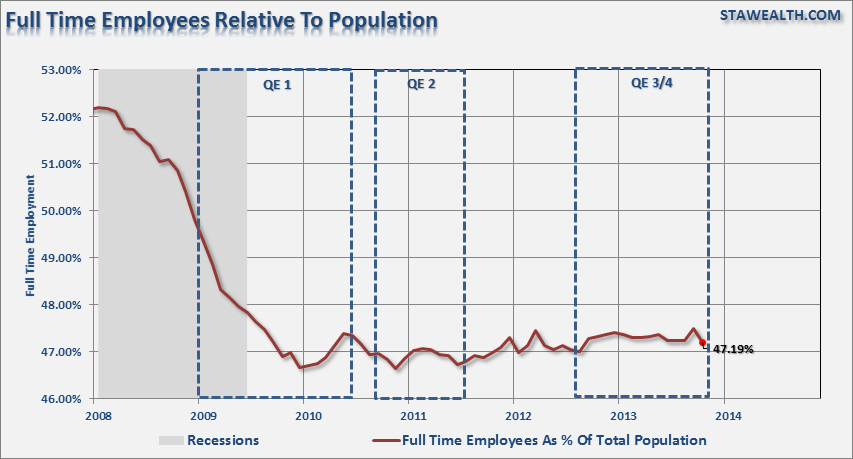
It is clear that QE programs have asset prices. However, such programs have failed to translate into organic economic growth beyond the initial inventory restocking cycle in 2009-10. Furthermore, the employment number is a bit misleading as it does not take into account the growth of the working age population. The only type of employment that really matters is full-time employment. Full-time employment garners higher rates of disposable personal incomes, increases household formation and boosts consumption which contributes to organic economic prosperity. The problem is that, as shown in the chart below, full-time employment relative to the population has NOT improved since the financial crisis. This is because the improvement in employment, as reported by the BLS, has not kept up with the rate of population growth.
The understanding that QE programs inflate asset prices is not lost on the financial markets. This is why any discussion of "tapering" sends investors scurrying to the sidelines. However, as I stated previously:
| The lack of transmission of the current monetary interventions into the real economy has remained a conundrum for the Federal Reserve as the gap between improving economic statistics and the real underlying economic fabric continues to widen. As Larry states, we are indeed in uncharted territory. With the direct manipulation of interest rates near impossible, it leaves only verbal (forward guidance) and liquidity (increases of excess reserves) policy tools available. The problem is that these tools have never been used to such a massive extent before in history. While analysts and economist continue to suggest, with each passing year, that stronger economic growth is coming; it has yet to be the case. As discussed previously, this is a tell-tale sign of a liquidity trap. |
For the Federal Reserve, they are now caught in the same "liquidity trap" that has been the history of Japan for the last three decades. With an aging demographic, which will continue to strain the financial system, increasing levels of indebtedness and poor fiscal policy to combat the issues restraining economic growth, it is unlikely that continued monetary interventions will do anything other than simply foster the next boom/bust cycle in financial assets.
Should we have an expectation that the same monetary policies employed by Japan will have a different outcome in the U.S? Anything is certainly possible. However, history suggests that artificial, liquidity driven, market inflations always end poorly. The problem today is that the Federal Reserve continues to operate under the premise that increasing the "wealth effect" will ultimately lead to a return of consumer confidence and a fostering of economic growth? Currently, there is little real evidence to support that theory
Originally posted at Lance's blog: STA Wealth Management

