
Hasbro, Inc. (NASDAQ:HAS) reported robust second-quarter 2019 results, wherein both earnings and revenues surpassed the Zacks Consensus Estimate. Notably, the top and bottom lines outpaced the respective estimate for the second straight quarter.
Following the quarterly results, shares of the company increased more than 5% during the pre-market trading session. Year to date, the stock has gained 33.6% compared with the industry’s 8.4% growth.
Adjusted earnings came in at 78 cents per share, which surpassed the Zacks Consensus Estimate of 51 cents. In the prior-year quarter, the company had reported earnings of 48 cents per share.
Net revenues totaled $984.5 million, which outpaced the Zacks Consensus Estimate of $967 million and also increased 9% from the prior-year quarter. The upside can be primarily attributed to a robust performance by the U.S. and Canada segment as well as the Entertainment, Licensing and Digital segment.
Brand Performances
The Franchise Brand posted revenues of $576.7 million, up 14% year over year. Notably, an increase in sales at MAGIC: THE GATHERING, MONOPOLY and PLAY-DOH led to the upside. Franchise Brand revenues also improved at the U.S. and Canada, and Entertainment, Licensing and Digital segments.
Partner Brands’ revenues rose 3% to $213.4 million owing to rise in Marvel's Avengers and Spider-Man franchises. The same grew at the U.S. and Canada but were flat at the International segment.
The Hasbro Gaming revenues came in at $123.4 million. Revenues increases from DUNGEONS & DRAGONS, YAHTZEE and CONNECT 4 were overshadowed by revenue decline at other games. Hasbro Gaming revenues decreased at the U.S. and Canada, and International segments. However, Hasbro’s total gaming category surged 26% to $393.4 million.
Meanwhile, Emerging Brands’ revenues increased 28% year over year to $71 million.
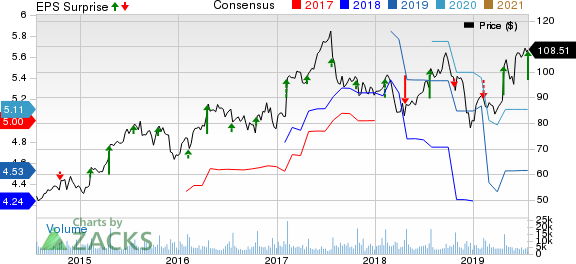
Hasbro, Inc. Price, Consensus and EPS Surprise
Segmental Revenues
Regionally, net revenues at the U.S. and Canada segment rose 14% to $510.5 million in the second quarter. The segmental performance was driven by growth at Franchise Brands, Partner Brands and Emerging Brands, which overshadowed decline in Hasbro Gaming revenue. Moreover, the operating profit margin was 20.9% compared with 16.3% in the prior-year quarter.
The International segment’s revenues summed $377.4 million, which declined 1% year over year. The downside can be primarily attributed to soft Hasbro Gaming revenues, which overshadowed growth at Franchise and Emerging Brand. The segment’s operating margin came in at 3.9% in the quarter under review. The metric was flat in the prior-year quarter.
Meanwhile, revenues at the Entertainment and Licensing segment surged 28% year over year to $96.5 million. However, the segment’s operating margin contracted to 8.2% compared with 28.8% in the prior-year quarter.
Operating Highlights
Hasbro's cost of sales, as a percentage of net revenues, decreased 250 bps to 34.9%. Selling, distribution and administration expenses, as a percentage of net revenues, were 25.2%, down from 28% in the prior-year quarter.
Balance Sheet
Cash and cash equivalents as of Jun 30, 2019, amounted to $1,151 million, down from $1,159 million as of Jul 1, 2018. At the end of the reported quarter, inventories totaled $564.8 million compared with $610.2 million in the prior-year quarter.
Long-term debt increased to nearly $1,695.8 million as of Jun 30, 2019, from $1,694.4 million as of Jul 1, 2018.
Hasbro’s board of directors declared a quarterly cash dividend of 68 cents per common share. The dividend will be payable Aug 15, 2019, to its shareholders of record at the close of business as of Aug 1, 2019.
In second-quarter 2019, the company repurchased 96,122 shares of common stock at a total cost of $9.5 million. At the end of the quarter, $369.3 million was available under the current share repurchase authorization.
Zacks Rank & Other Stocks to Consider
Hasbro, which shares space with Mattel, Inc. (NASDAQ:MAT) , sports a Zacks Rank #1 (Strong Buy). You can see the complete list of today’s Zacks #1 Rank stocks here.
Other top-ranked stocks in the same space include Take-Two Interactive Software, Inc. (NASDAQ:TTWO) and Electronic Arts Inc. (NASDAQ:EA) , each carrying a Zacks Rank #2 (Buy).
Shares of Take-Two Interactive Software have gained 24.6% in the past three months.
Electronic Arts’ long-term earnings are likely to grow by 16.5%.
Today's Best Stocks from Zacks
Would you like to see the updated picks from our best market-beating strategies? From 2017 through 2018, while the S&P 500 gained +15.8%, five of our screens returned +38.0%, +61.3%, +61.6%, +68.1%, and +98.3%.
This outperformance has not just been a recent phenomenon. From 2000 – 2018, while the S&P averaged +4.8% per year, our top strategies averaged up to +56.2% per year.
See their latest picks free >>
Mattel, Inc. (MAT): Free Stock Analysis Report
Hasbro, Inc. (HAS): Free Stock Analysis Report
Take-Two Interactive Software, Inc. (TTWO): Free Stock Analysis Report
Electronic Arts Inc. (EA): Free Stock Analysis Report
Original post