
Hasbro Inc. (NASDAQ:HAS) posted robust first-quarter 2017 results, wherein both earnings and revenues surpassed the Zacks Consensus Estimate.
Change in Reporting
Notably, beginning with the first quarter of 2017 earnings, Hasbro has started reporting its revenues by brand portfolio that include Franchise Brands, Partner Brands, Hasbro Gaming and Emerging Brands. The company has ceased providing revenue breakdown by product category: Boys, Games, Girls and Preschool.
Earnings and Revenues Discussion
Adjusted earnings of 43 cents per share beat the Zacks Consensus Estimate of 37 cents by 16.2% and surged 13.2% year over year.
Hasbro's net revenue of $849.7 million also increased 2% over the prior-year quarter. Moreover, revenues beat the Zacks Consensus Estimate of $833.3 million by nearly 2%. Notably, revenues improved in two out of its four brand portfolios. While Franchise Brands, Hasbro Gaming and Emerging Brands recorded a gain, revenues declined at Partner Brands.
Hasbro's cost of sales ratio increased 110 basis points (bps) to 36.0%. Meanwhile, selling, distribution and administration expenses rose 60 bps, but royalty expense ratio declined 80 bps. Additionally, operating profit declined 8.8% year over year to $78.3 million, due to higher costs.
Behind the Headline Numbers
The Franchise Brand portfolio posted revenues of $423.6 billion, up 2% year over year, driven by revenue growth in Nerf, Transformers and Monopoly brands.
Partner Brand revenues declined 18% to $213.0 million as weakness in Star Wars and Marvel brands more than offset the growth in Beyblade and Dreamworks’ Trolls.
The Hasbro Gaming portfolio recorded a 43% year-over-year rise in revenues to $142.0 million. Growth was led by several new games, including Speak Out, Toilet Trouble and Fantastic Gymnastics, coupled with digital gaming as well as several other gaming brands, including Dungeons & Dragons, Bop-It and Pie-Face.
Emerging Brands revenues grew 25% to $70.2 million, driven by increases from Baby Alive and Furreal Friends products.
Regionally, net revenue from the U.S. and Canada segment inched up 2% to $451.6 million, supported by growth in Hasbro Gaming and Emerging Brands portfolios. However, the net revenue was partly offset by a dip in Franchise Brands and Partner Brands revenues in the region. The segment reported operating profit of $64.8 million, reflecting a decline of 17% year over year.
International revenues were $345.3 million, essentially flat year over year. Revenue growth in Franchise Brands, Hasbro Gaming and Emerging Brands was offset by a decline in Partner Brands. Increases in sales were registered in Latin America and Emerging markets, but Europe and Asia Pacific registered declines. Moreover, international operating profit was $544.0 million, down 81% from a year ago.
The Entertainment and licensing segment revenues improved 24% year over year to $52.8 million, on the back of growth Digital Gaming, including higher revenues at Backflip Studios. Furthermore, the segment's operating profit jumped up 108% to $11.3 million.
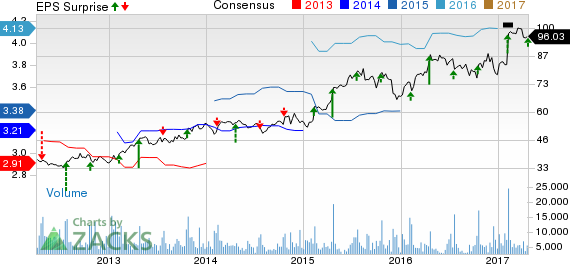
Hasbro, Inc. Price, Consensus and EPS Surprise
Zacks Rank & Stocks to Consider
Currently, Hasbro carries a Zacks Rank #3 (Hold). Better-ranked stocks in the broader Consumer Discretionary sector include:
Nintendo Co (T:7974).’s (OTC:NTDOY) current fiscal year earnings are expected to grow a momentous 364.4%, while the industry average growth is expected to be about 13.9%. Nintendo sports a Zacks Rank #1 (Strong Buy). You can see the complete list of today’s Zacks #1 Rank stocks here.
Boyd Gaming Corporation (NYSE:BYD) is a Zacks Rank #2 (Buy) company. Its current year and next year earnings estimates have moved up 1.8% and 1.5%, respectively, over the last 60 days.
Penn National Gaming, Inc. (NASDAQ:PENN) is another Zacks Rank #2 company whose earnings surpassed the Zacks Consensus Estimate in each of the last four quarters, with an average beat of 67.45%.
More Stock News: This Is Bigger than the iPhone!
It could become the mother of all technological revolutions. Apple (NASDAQ:AAPL) sold a mere 1 billion iPhones in 10 years but a new breakthrough is expected to generate more than 27 billion devices in just 3 years, creating a $1.7 trillion market.
Zacks has just released a Special Report that spotlights this fast-emerging phenomenon and 6 tickers for taking advantage of it. If you don't buy now, you may kick yourself in 2020. Click here for the 6 trades >>
Boyd Gaming Corporation (BYD): Free Stock Analysis Report
Penn National Gaming, Inc. (PENN): Free Stock Analysis Report
Hasbro, Inc. (HAS): Free Stock Analysis Report
Nintendo Co. (NTDOY): Free Stock Analysis Report
Original post
Zacks Investment Research