The US dollar was seen trading on the back foot on Monday with the US markets closed on account of Columbus Day holiday. The euro and the British pound were seen posting some modest gains as a result. In the UK, data from the ONS showed that the labor costs in the UK were seen rising and higher than previously estimated.
This helped to support the British pound as investors saw this as a positive for the Bank of England. The central bank is expected to hike interest rates in a couple of months. Economic data yesterday was limited to the German industrial production which posted a strong rebound as industrial output rose 2.6% on the month.
The Eurozone Sentix investor confidence data also increased from 28.2 previously to 29.6. Looking ahead, a somewhat busy day today will see the release of the UK's industrial, manufacturing and construction output data. FOMC Member, Kashkari will be speaking today while from the Eurozone, industrial production figures from France are expected.
EUR/USD Intraday Analysis

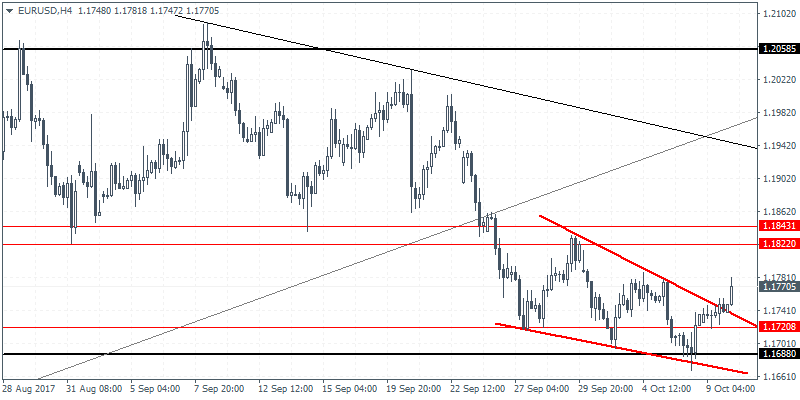
EUR/USD (1.1770):The common currency was seen posting some modest gains following through from last Friday's bullish close. However, price action remains limited at the moment as EUR/USD approaches the 1.1800 handle. On the 4-hour chart, EUR/USD has managed to post a breakout from the falling wedge pattern. A continued upside momentum could see EUR/USD testing the previous resistance at 1.1822. A reversal at this level could, however, see the possible bearish trend being resumed. Meanwhile, in the short term, expect EUR/USD to remain range bound within 1.1822 resistance and 1.1720 support.
USD/JPY Intraday Analysis

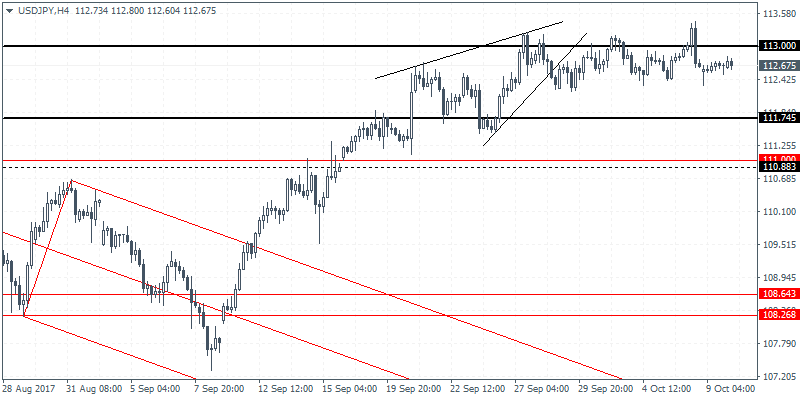
USD/JPY (112.67):The Japanese yen continues to remain mixed with USD/JPY seen posting a consolidation near the 113.00 price level for the past few days. On the 4-hour chart, the resistance at 113.00 is clearly seen and this could suggest that the upside momentum is fading. With support seen at 111.74, USD/JPY is likely to move sideways in the near term. A possible breakout from this range, however, could signal further direction in prices. To the upside, a breakout above 113.00 will need to see a retest of this level as support to maintain further gains. To the downside, a breakdown below 111.74 will signal the downside decline that could extend to 111.00 initially.
XAU/USD Intraday Analysis

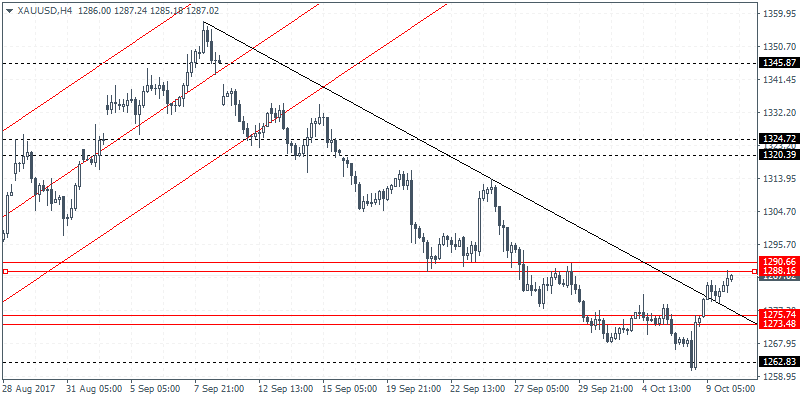
XAU/USD (1287.02):Gold prices have likely completed the downside decline after price posted a strong reversal after testing the 1262.80 support level. The subsequent rally from this support pushed gold prices to close above the immediate resistance of 1275 - 1273 and also breaking past the falling trend line. Further gains could see gold prices rising towards the 1290 handle. However, establishing support near 1275 - 1273 could validate the bullish bias.
