Get 40% Off
🚨 Volatile Markets? Find Hidden Gems for Serious Outperformance
Find Stocks Now

Is The CRB Index Rolling Over?

Published 03/28/2016, 11:44 AM
Updated 07/09/2023, 06:31 AM

CRB Index (Commodities)

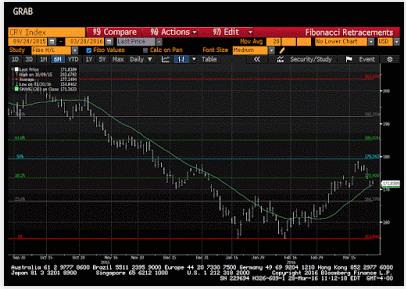
This Great Graphic, created on Bloomberg, depicts the CRB Index, a basket of commodity prices. The technical picture has deteriorated, and the price action in the coming sessions is particularly important in determining outlook.


The CRB Index put in a double bottom. On January 20 and February 11 lows were set just below 155.00. The neckline of the double bottom was created in the rally between the two bottoms. It is found near 168.00. The measuring objective is found by rotating the pattern on its neckline. It is near 181.00. On March 18, the CRB Index made a high just below 179.00, just ahead of the 50% retracement objective of the decline since the mid-October 2015.

The CRB Index gapped lower on March 24 and has not filled the gap today. It is found between last Wednesday's low (~173.20 ) and last Thursday's high (~172.57). It had gapped higher on March 17 but filled the gap on the large sell-off from March 23. If that first gap had not been filled, it would have left a bearish island gap in its wake.

On the downside, there are two levels to monitor, that if penetrated would strength the bearish technical case. The first is the 20-day moving average (~171.30). The CRB index has not closed below this moving average for a little over a month. The second and more important level is around 169.50. A little shelf was created near there earlier this month. It corresponds to a 38.2% retracement of the rally since the February low.

3rd party Ad. Not an offer or recommendation by Investing.com. See disclosure here or remove ads .

Given the high correlation between crude oil and the CRB Index (over 0.9 on a 60-day percent change basis), it is not surprising that the oil futures price action is quite similar. The May light sweet contract is trading heavily today near $39 a barrel. It peaked on March 18 near $42.50. It is toying with the 20-day moving average just above $39.00. The $37.70-$38.00 area corresponds to a 38.2% retracement of its gains since February 11 and the low on March 15. A break would signal a move toward $36.60 and possibly $35.

Original Post

Latest comments

Risk Disclosure: Trading in financial instruments and/or cryptocurrencies involves high risks including the risk of losing some, or all, of your investment amount, and may not be suitable for all investors. Prices of cryptocurrencies are extremely volatile and may be affected by external factors such as financial, regulatory or political events. Trading on margin increases the financial risks.
Before deciding to trade in financial instrument or cryptocurrencies you should be fully informed of the risks and costs associated with trading the financial markets, carefully consider your investment objectives, level of experience, and risk appetite, and seek professional advice where needed.
Fusion Media would like to remind you that the data contained in this website is not necessarily real-time nor accurate. The data and prices on the website are not necessarily provided by any market or exchange, but may be provided by market makers, and so prices may not be accurate and may differ from the actual price at any given market, meaning prices are indicative and not appropriate for trading purposes. Fusion Media and any provider of the data contained in this website will not accept liability for any loss or damage as a result of your trading, or your reliance on the information contained within this website.
It is prohibited to use, store, reproduce, display, modify, transmit or distribute the data contained in this website without the explicit prior written permission of Fusion Media and/or the data provider. All intellectual property rights are reserved by the providers and/or the exchange providing the data contained in this website.
Fusion Media may be compensated by the advertisers that appear on the website, based on your interaction with the advertisements or advertisers.
© 2007-2024 - Fusion Media Limited. All Rights Reserved.