Get 40% Off
🚨 Volatile Markets? Find Hidden Gems for Serious OutperformanceFind Stocks Now

Google Class C Stock Tests An Upside Line

Published 09/08/2020, 06:46 AM
Updated 07/09/2023, 06:31 AM

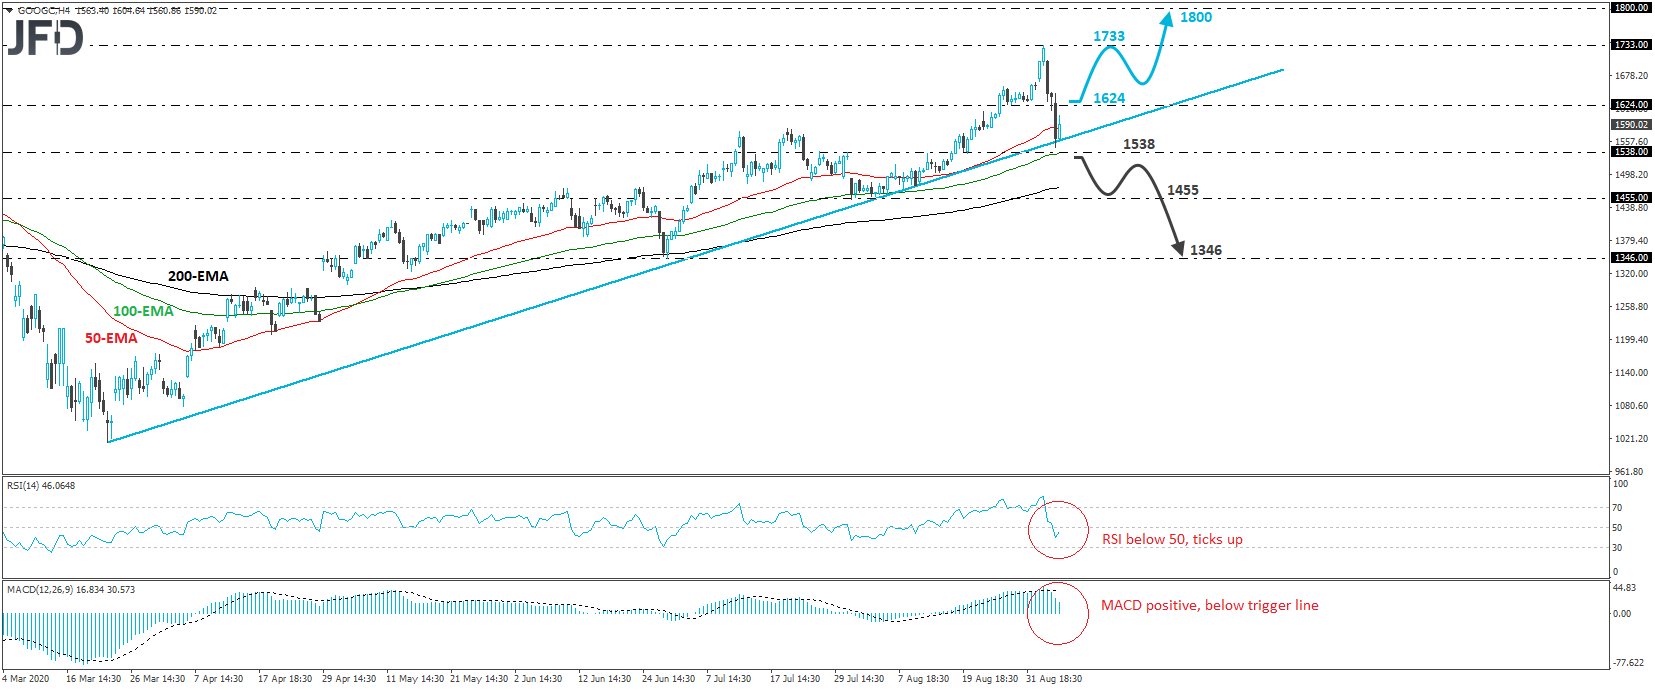
After hitting a new record high at 1733 last Wednesday, the Google (NASDAQ:GOOGL) Class C stock tumbled on Thursday and Friday, to test waters slightly below the upside support line drawn from the low of March 23rd. Then the stock rebounded somewhat to finish the week above that line. Thus, having in mind that investors managed to keep the Google stock above that line, we would consider the medium-term outlook to still be positive.

That said, in order to get confident on a trend continuation, we would like to see a decent recovery above 1624, a level defined as a resistance by the inside swing low of August 27th. Such a move may invite more buyers into the game, who may shoot for another test near the record peak of 1733. A clear break above that hurdle would take the price into uncharted territory, and thus, with no prior peaks and troughs to mark higher resistances, we would consider as the next possible target the psychological zone of 1800.

Shifting attention to our short-term momentum studies, we see that even though the RSI has ticked up, it remains below 50, while the MACD, although positive, runs below its trigger line. These indicators detect a lack of upside speed – actually the RSI is showing downside momentum –, which adds more credence to our view of waiting for a move above 1624 before getting confident of another round of buying.

What could change the outlook to a bearish one, may be a decisive dip below 1538, a barrier that provided resistance between July 27th and August 13th.  The price would already be below the pre-mentioned upside line, and may drift towards the low of July 31st, at around 1455. Another dip, below 1455, may extend the tumble towards the low of June 29th, at 1346.
Google class C stock 4-hour chart technical analysis

3rd party Ad. Not an offer or recommendation by Investing.com. See disclosure here or remove ads .

Latest comments

Risk Disclosure: Trading in financial instruments and/or cryptocurrencies involves high risks including the risk of losing some, or all, of your investment amount, and may not be suitable for all investors. Prices of cryptocurrencies are extremely volatile and may be affected by external factors such as financial, regulatory or political events. Trading on margin increases the financial risks.
Before deciding to trade in financial instrument or cryptocurrencies you should be fully informed of the risks and costs associated with trading the financial markets, carefully consider your investment objectives, level of experience, and risk appetite, and seek professional advice where needed.
Fusion Media would like to remind you that the data contained in this website is not necessarily real-time nor accurate. The data and prices on the website are not necessarily provided by any market or exchange, but may be provided by market makers, and so prices may not be accurate and may differ from the actual price at any given market, meaning prices are indicative and not appropriate for trading purposes. Fusion Media and any provider of the data contained in this website will not accept liability for any loss or damage as a result of your trading, or your reliance on the information contained within this website.
It is prohibited to use, store, reproduce, display, modify, transmit or distribute the data contained in this website without the explicit prior written permission of Fusion Media and/or the data provider. All intellectual property rights are reserved by the providers and/or the exchange providing the data contained in this website.
Fusion Media may be compensated by the advertisers that appear on the website, based on your interaction with the advertisements or advertisers.
© 2007-2024 - Fusion Media Limited. All Rights Reserved.