The Best Time of Month to Hold Bonds
Let’s make this as simple as possible. The best period of the month for t-bonds is (drum roll please):
The last five trading days of the month.
Well it doesn’t get much simpler than that does it? But don’t take my word for it, consider some results. For our test I am using a “continuous” t-bonds futures contract. This particular data series is built by each day adding the daily change in the front-month t-bond futures contract. Ultimately it is not the price reflected that matters so much as it is the daily gain or loss.
For a t-bond futures contract a gain of $1 in the futures contract price equals $1,000 gain in contract value (if long, or a $1,000 loss for the day if holding a short position). So if t-bond futures are trading at a price of 100 then the actual contract value is $100,000. If price rises the next day to 101 then the contract value rises to $101,000 and the net change is +$1,000.
Results
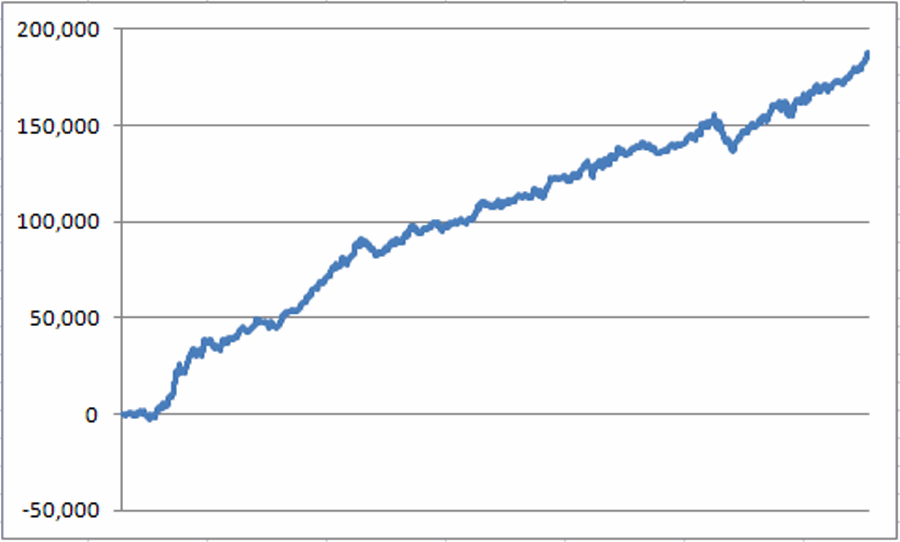
Figure 1 displays the growth of holding long one t-bond futures contract during the last five trading days of each month starting on 12/31/1983. Please note that these figures include no slippage or commissions so these do not represent “real world” returns. Still, the purpose here is not to advocate this as a standalone strategy. The purpose here is simply to highlight a trend. See if anything jumps out at you in Figure 1.

Anyone notice a trend? Now the truth is that this is by no means a straight line advance and certainly bonds do not make money during the last five days of every month. In addition, if you deduct something for slippage and commissions this line will look less attractive. Still, to gain a slightly greater appreciation, consider what has happened during what we “quantitative types” scientifically refer to as “all the other days.”
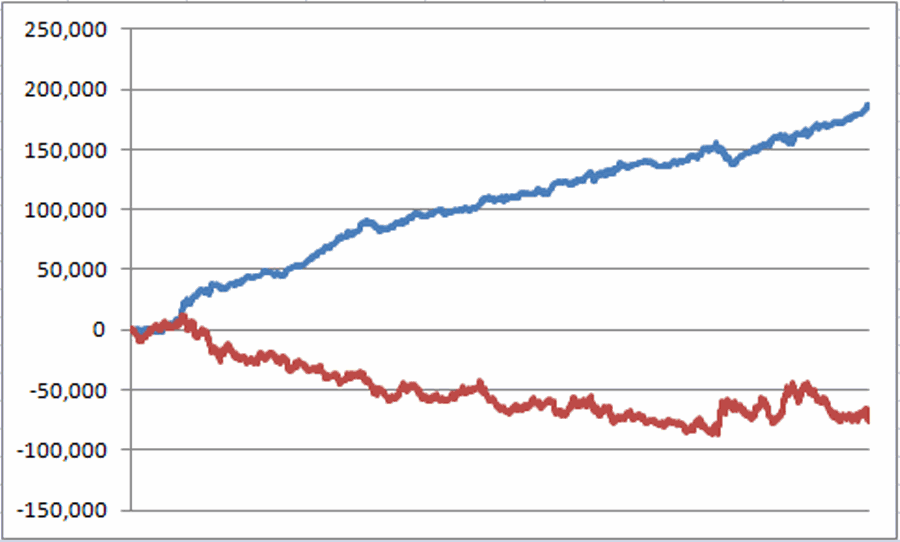
Figure 2 includes the same equity curve for the last five trading days of the month as shown in Figure 1. It also includes the performance generated by hold a long position in t-bond futures during all trading days EXCEPT the last five trading days of the month.
Figure 2 – T-bond performance during last 5 trading days of month (blue) versus t-bond performance during all other days (red); 12/1983 through 2/2015
Notice any difference? For the record, performance differences of this magnitude are what we quantitative types refer to as “statistically significant.” For the record, if we look at rolling 5-year rates of return:
-The 5-year return for the “Last Five Days” period has showed a gain 87% of the time
-The 5-year return for “All the Other Days” has showed a gain 39% of the time
In a future installment we’ll look at some ways for non futures traders to take advantage of these trends.
ADDENDUM
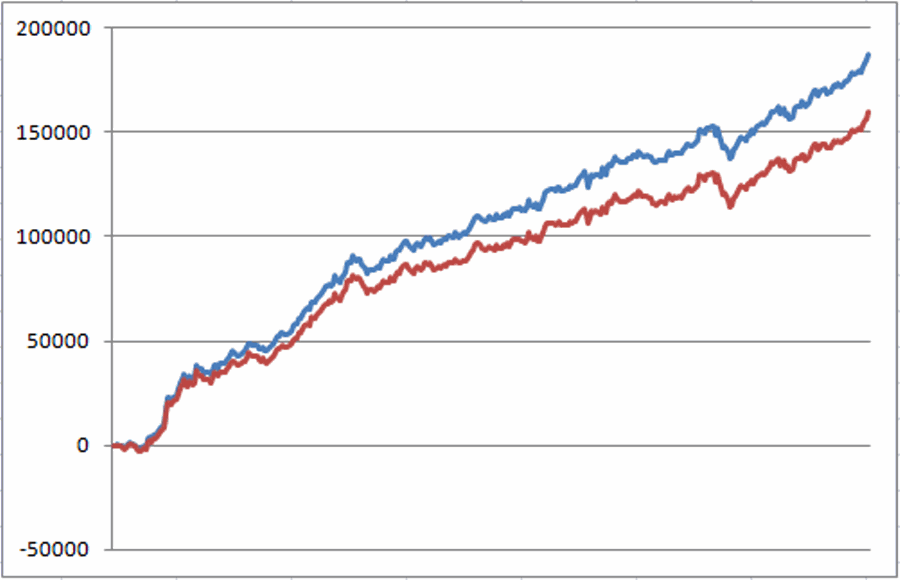
OK, after I posted this originally I got ambitious (it happens once in a while) and out of curiosity went back and subtracted $75 for slippage and commission each month during the last 5 trading days of each month. The results appear in Figure 3.
Figure 3 – T-Bonds last five trading days of month with no slippage or commissions (blue); T-Bonds last five trading days of month minus $75 slippage and commission each month (red); 12/1983-2/2014
While the results are obviously less, the key point is that the overall favorable trend remains in force. While I still am not necessarily advocating this as a standalone strategy, there does appear to be “something there.”


