Get 40% Off
🚨 Volatile Markets? Find Hidden Gems for Serious Outperformance
Find Stocks Now

Gold slides below 50-day SMA, hitting ascending trendline

Published 02/12/2024, 05:49 AM
Updated 05/01/2024, 03:15 AM
  • Gold trades sideways in the past week
  • Closes profoundly below the 50-day SMA on Friday
  • Momentum indicators turn negative
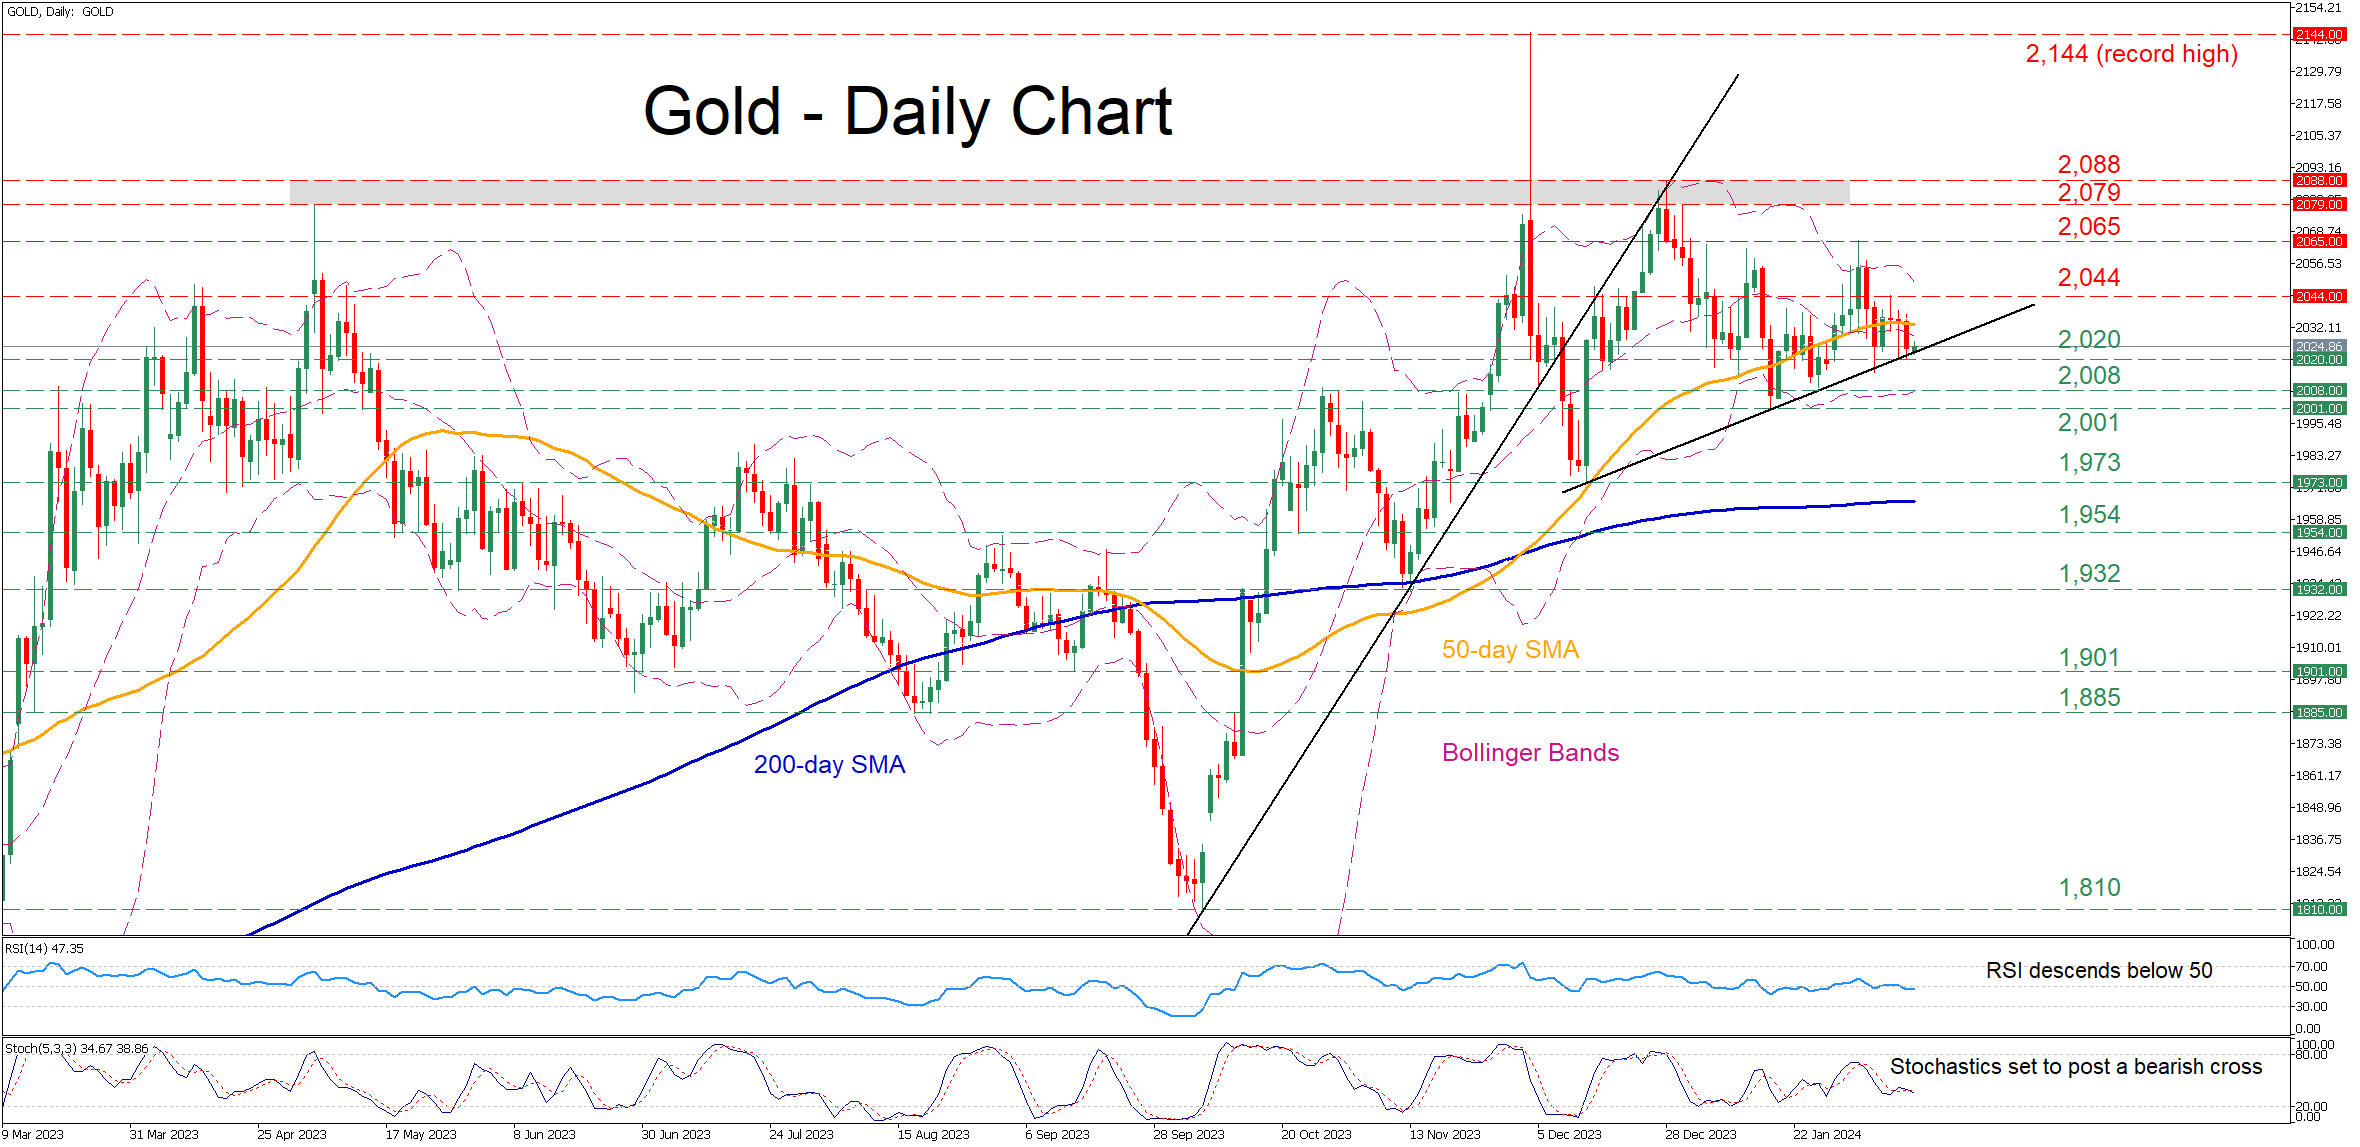
  • Gold has been rangebound in the past few trading sessions, following its rejection at the 2,065 mark on February 1. However, on Friday, the price dived beneath the 50-day simple moving average (SMA) before finding its feet at the ascending trendline that connects higher lows since December.

    If bearish pressures persist, the price could initially test the recent support of 2,020. Breaking below that zone, bullion may descend towards 2,008 ahead of the January low of 2,001. Even lower, the December bottom of 1,973 could provide downside protection.

    Alternatively, should the bulls re-emerge and attempt to push the price higher, the recent resistance of 2,044 could be the first barrier in their way. Failing to halt there, the price may challenge the February high of 2,065. An upside violation of that zone could open the door for the crucial 2,079-2,088 range.

    In brief, gold retreated below the 50-day SMA as the short-term oscillators dropped to their negative regions. However, a steep decline has been avoided so far as the upward sloping trendline drawn from December has been holding its ground.

Latest comments

Risk Disclosure: Trading in financial instruments and/or cryptocurrencies involves high risks including the risk of losing some, or all, of your investment amount, and may not be suitable for all investors. Prices of cryptocurrencies are extremely volatile and may be affected by external factors such as financial, regulatory or political events. Trading on margin increases the financial risks.
Before deciding to trade in financial instrument or cryptocurrencies you should be fully informed of the risks and costs associated with trading the financial markets, carefully consider your investment objectives, level of experience, and risk appetite, and seek professional advice where needed.
Fusion Media would like to remind you that the data contained in this website is not necessarily real-time nor accurate. The data and prices on the website are not necessarily provided by any market or exchange, but may be provided by market makers, and so prices may not be accurate and may differ from the actual price at any given market, meaning prices are indicative and not appropriate for trading purposes. Fusion Media and any provider of the data contained in this website will not accept liability for any loss or damage as a result of your trading, or your reliance on the information contained within this website.
It is prohibited to use, store, reproduce, display, modify, transmit or distribute the data contained in this website without the explicit prior written permission of Fusion Media and/or the data provider. All intellectual property rights are reserved by the providers and/or the exchange providing the data contained in this website.
Fusion Media may be compensated by the advertisers that appear on the website, based on your interaction with the advertisements or advertisers.
© 2007-2024 - Fusion Media Limited. All Rights Reserved.