The price of gold bounced up last week after Donald Trump announced import tariffs on steel and aluminium brought uncertainty back to the landscape. The President went even further by saying that if Europe retaliates against the tariffs, the US will impose a tax on cars made by European manufacturers, such as Volkswagen (DE:VOWG_p), BMW (DE:BMWG)and Daimler (DE:DAIGn). Analysts even expressed concerns that a “global trade war” is going to take place as other countries, such as China and Canada, are expected to take countermeasures against the protective trade policy of the United States.
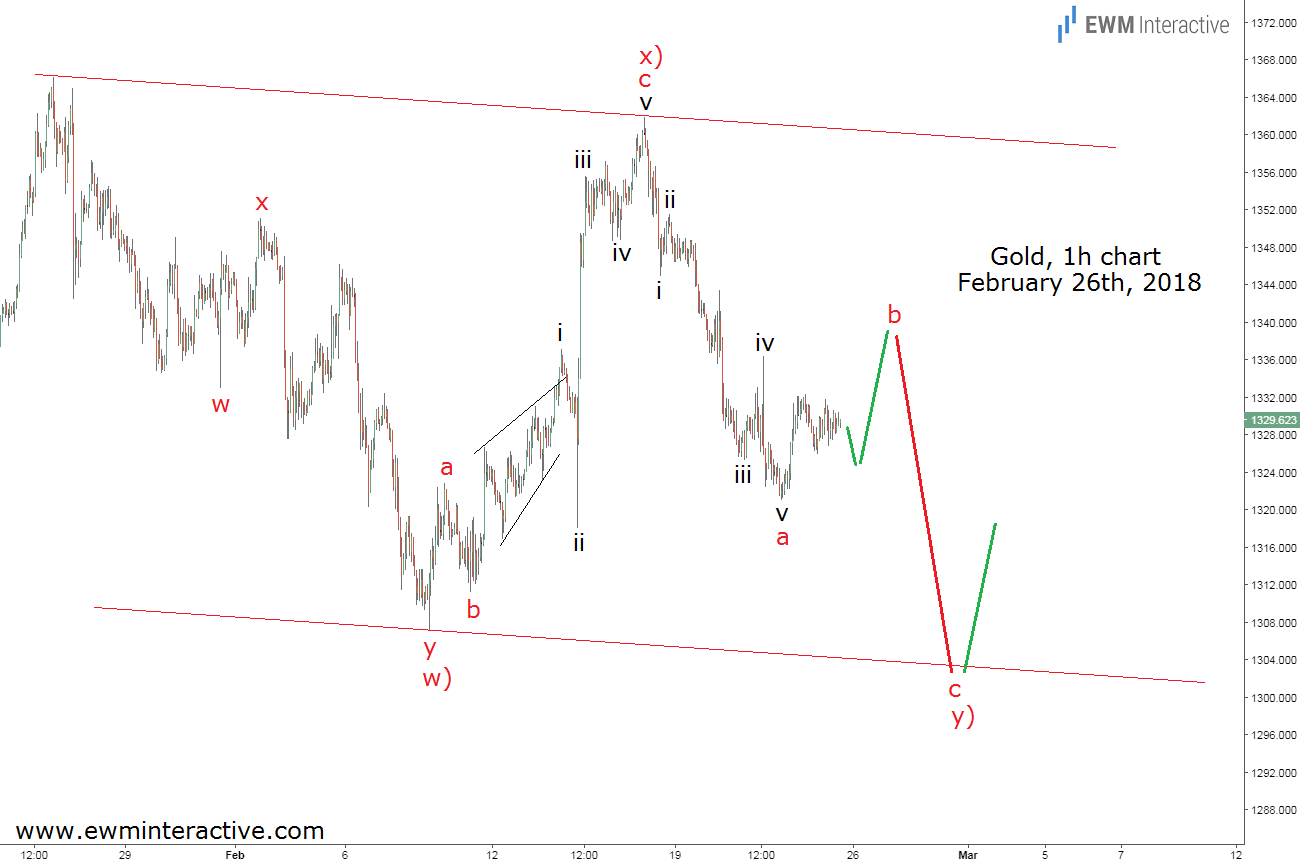
Despite Bitcoin’s attempts to take its place, gold is still known as the best safe-haven asset. Common sense dictates that as economic and political uncertainty rises, investors would rush to buy large quantities of the yellow metal. That is exactly what happened in the end of last week, when gold prices bounced up from under $1303 to $1322. The problem is that in order for traders to predict gold’s price swings, they had to be able to read Mr. Trump’s mind and that is not an easy task, to say the least. We would not even try. Instead, we rely on the Elliott Wave Principle, which in this case not only managed to prepare us for gold’s positive reaction to the possibility of a global trade war, but also put us ahead of the preceding decline in the price of the precious metal. The chart below, sent to clients before the market opened on Monday, February 26th, explains how.
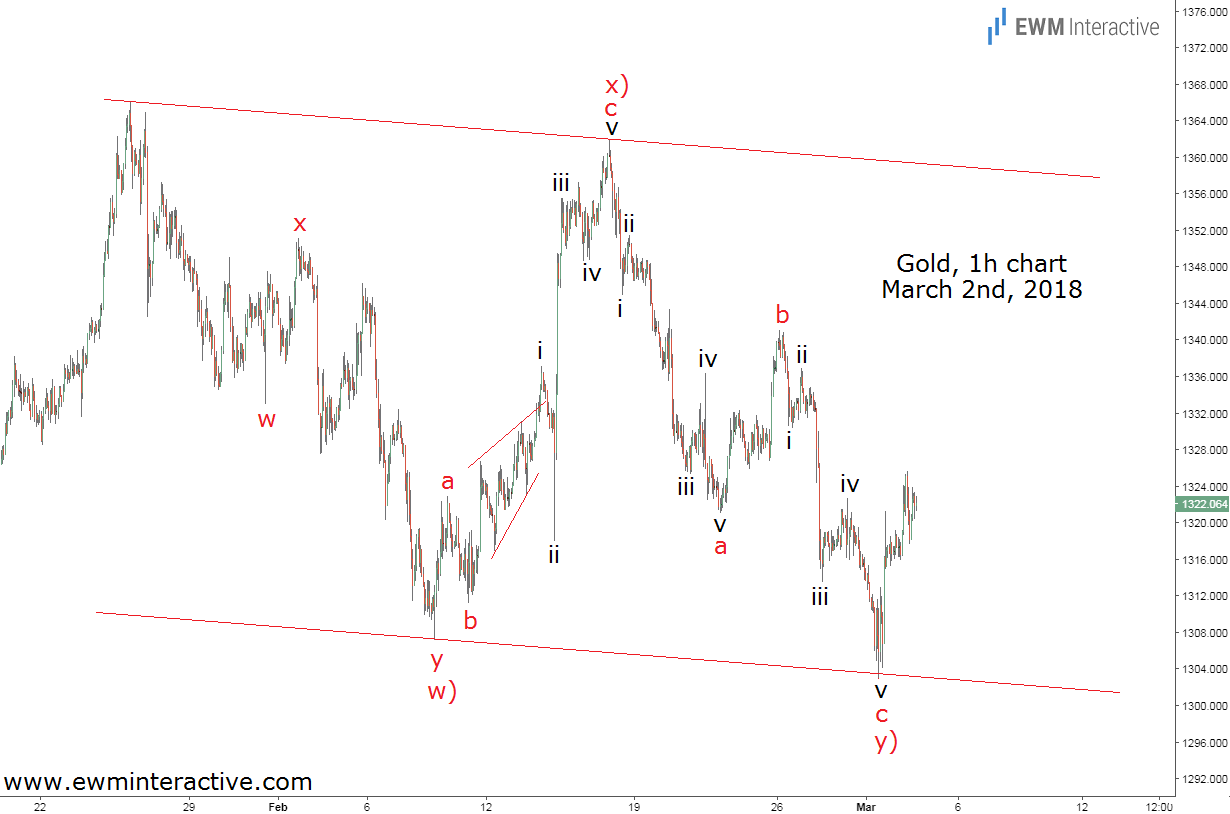
As visible, the wave structure suggested gold is in the third phase – wave y) – of a w)-x)-y) double zig-zag correction. Zig-zags usually develop within the parallel lines of a corrective channel, so it made sense to anticipate more weakness towards the support of the lower line of the channel near $1300. Wave “a” of y) was a textbook five-wave impulse, which meant that once wave “b” was over near the resistance of wave iv of “a”, gold prices should plunge again in wave “c” to complete the entire pattern before changing direction once more. Five days later, on Friday, March 2nd, the hourly price chart of XAU/USD looked like this:

Wave “b” of y) topped out at $1341 and gave then gave the start of wave “c”, which touched the lower boundary of the channel four days later at $1302.68. It was Thursday. And what a coincidence, President Trump announced his steel import tariffs the same day to trigger the anticipated bounce, which sent gold to $1325 on Friday.
In our opinion, if it was not the tariffs, something else would have sent bullion higher, because the market appeared to have made up its mind a week earlier. The exact piece of news that triggers the move is not that important. What is important is the wave structure, which put us ahead of both gold’s plunge and subsequent recovery.
What lies ahead is even more interesting, especially if a global trade war erupts…
