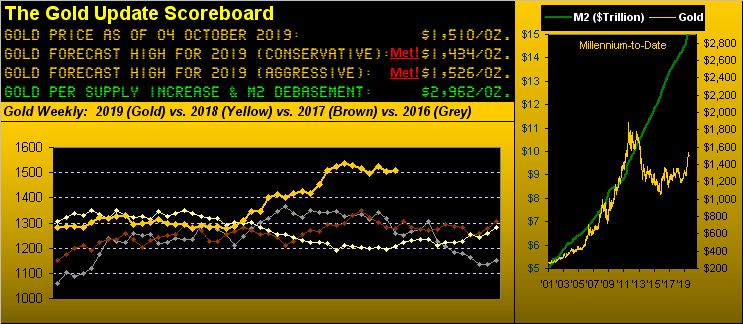
Yes, 'tis a double-entendre there, this missive's title: Gold's correction seeming "short" as brief and driven in part by those "short", (perhaps secretly trading in their briefs from undisclosed parental basements).
Regardless, be it profit-taking of late by traders or short-selling raiders, Gold through it all actually netted the barest of up weeks, settling yesterday (Friday) at 1510, for a seven-point (+0.5%) from where 'twas a week ago.
'Course, the route from then to now incorporated far more range. From the prior week's settle at 1503, come Tuesday Gold had found its way -2.5% down to 1465, nearly tapping our oft-mentioned structural support zone (1454-1434) before rebounding +4.2% to as high as (trumpet fanfare and drum-roll please) our vaunted centerpiece and year's this aggressive forecast high price of 1526. Clearly we've a Cannes-award winning film in the making here: "There's Something About 1526", this year's holiday blockbuster coming to a cinéma near you.
But be it a blockbuster or ballbuster as we turn to Gold's weekly bars, price is still in what we'd term as a "young" parabolic Short trend, just three weeks thus far in duration. That noted however, let's go deeper into the numbers: this Short trend marks the 40th one since 2001. The average duration of the prior 39 Short trends is 11 weeks, by which yardstick Gold time-wise ought still have some downside with which to deal, giving price a shot to actually reach that 1454-1434 support zone before this trend expires. Yet that said, "average" ought not be analyzed as "absolute", and indeed nine of those prior 39 Short trends (nearly one in four) lasted no longer than five weeks, this young one as depicted by the rightmost three red dots:
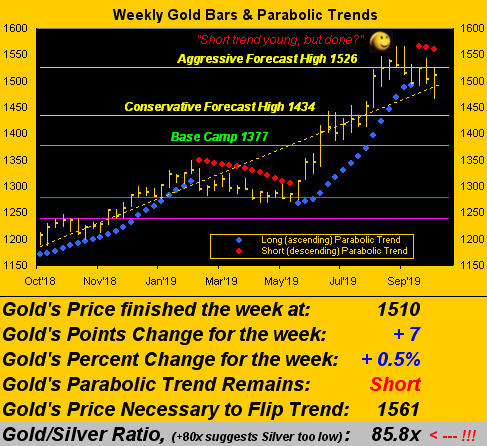
So by the technicals, we see Gold on balance as not quite out of its correction woods. And by the fundamentals, we see Gold as susceptible to careening about, be it higher by a Fed rate dump, or lower by further Dollar pump, or every which way (including loose) by all things Trump. And that's just near-term, say through this month, (the Federal Open Market Committee members voting their conscious come 30 October).
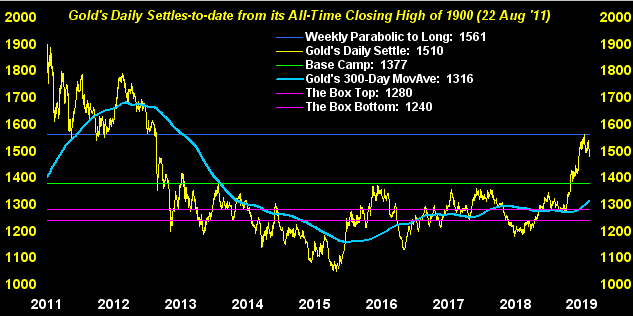
More broadly, here next is our chart of Gold's daily settles from its highest-ever more than eight years ago at 1900 on 22 August 2011. The horizontal blue line at 1561 is the price that need be eclipsed in the ensuing week to flip the aforeshown trend from Short back to Long. Gold presently being 1510 is 51 points below that hurdle and the "expected weekly trading range" is currently 48 points. So 'tis a bit of a stretch for that quick leap of faith, albeit two of this year's 40 trading weeks-to-date have put in net gains of better than 50 points:
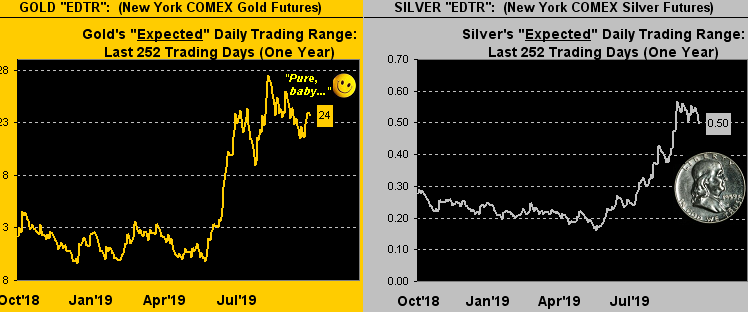
But be prices down-and-out or up-and-away, the precious metals are certainly are in play as we next see via their respective "expected daily trading range" measures from one year ago-to-date for Gold on the left and Silver on the right, again exemplary of traders' delight. Intraday we're eying the range between Gold's high and low at $24/oz. (synonymous with 24-carat purity), whilst Silver's range looks to be 50¢/oz. (such as to make Ben proud):
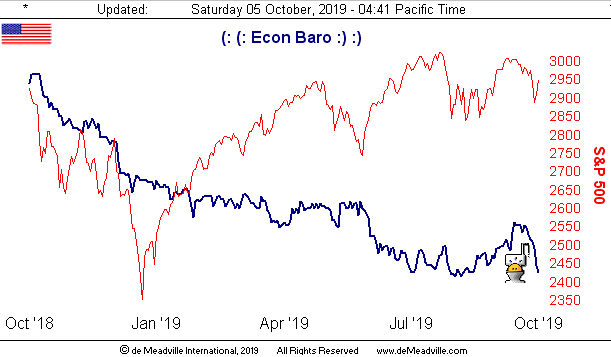
However: from proud to cowed went the Economic Barometer this past weak [pun] as a "buncha numbahs went into da dumpah" (a little Long Island lingo there). Obviously the most popular thread running through the FinAnalysts' cord is contraction in manufacturing as evidenced by September's reads from both the Chicago Purchasing Manager's Institute and the Institute for Supply Management, albeit the latter's survey for Services was indicative of continued expansion at a slowing rate. As well, the pace of August's Factory Orders slipped from a robust July into negativity, and the month's Trade Deficit also deepened.
'Course, the most curious number of them all was September's payrolls creation of 136,000 ... yet with the Unemployment Rate falling to a 50-year low at 3.5% ... which mathematically points to more jobs openin' than folks fillin' 'em. Which in furtherance heralds the need for a new metric that ought be added to the Bureau of Labor Statistics monthly Employment Situation report: let's call it "Current Unfilled Openings", aka the CUO, [pron. koo-oh]. Pretty cool, oh? Here's the Baro:
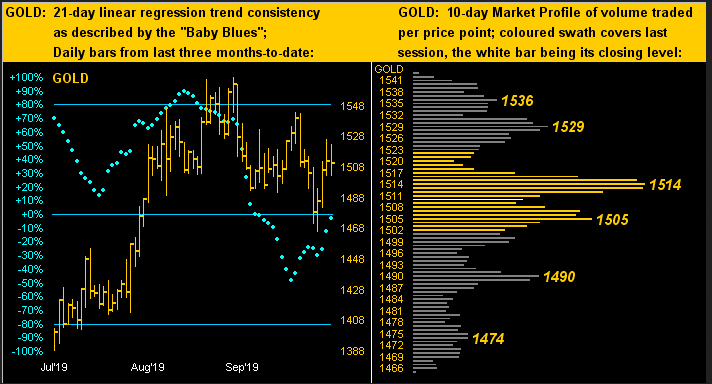
In the midst of it all came mid-week remarks from San Diego by New York FedPrez John "Centered" Williams (NYSE:WMB), balancing the economy as being in a "favorable place", its outlook being "mixed" in light of geo-political and other "crosscurrents". And that description is exactly apt for Gold in turning to its two-panel graphic of daily bars from three months ago-to-date at left and the 10-day Market Profile at right. Have a look at Gold's baby blue dots of regression trend consistency: barring sound selling come Monday, those dots shall cross above their 0% axis as the 21-day trend rotates to positive, (still within the broader measure of the weekly parabolic Short trend). Indeed a "favorable place" for Gold to be given all the "crosscurrents", Gold's present positioning nonetheless being "mixed" with price centered in the Profile:
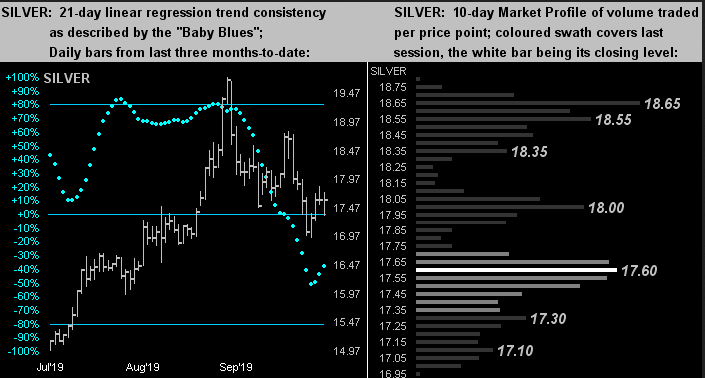
Sadly, Sister Silver's stance is not nearly as neutralized, her "Baby Blues" (below left) still at least a few days from getting above their 0% axis unless selling resumes. And by her Profile (below right) she's a bit sub-center, sittin' at present on the fairly dominant 17.60 support/resistance level:
Next week brings us a moderate amount of incoming data for the Econ Baro, the bias for which suggests it tipping further still should consensus expectations be reasonably accurate. So best to be in a boat that's not prone to tipping under downside economic inflection: The Gold Boat! Oh now yer cruisin', baby!