Gold has been on a seller’s market of late but I believe that it is time to reconsider whether a reversal is imminent. In this short article,I will present to you what I believe to be the dominant sentiment playing in the Gold markets now and why I am starting to look long albeit with caution.
Sentiment Cycle
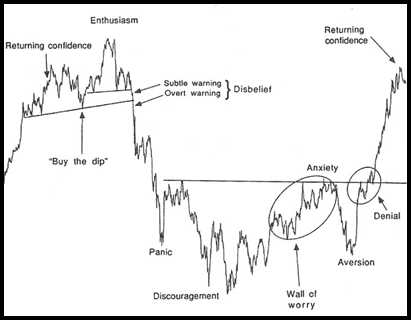
As a technical analyst, I extol the idea that price action is representative of collective market sentiment. I want to bring your attention to the sentiment cycle theory developed by Justin Mamis, a well-known author of several trading books. The Sentiment Cycle, according to Mamis, is basically a “graphical representation of the manic depressive moods typically experienced by market participants as a function of time and price in one complete sentiment loop.” One can easily do research on the Sentiment Cycle so I shall not go into detail, the picture below should suffice.
Taking a quick look at the D1 charts for Gold, we can immediately draw stark similarities at each given point. The questions is whether or not there is starting to be possible aversion in the Gold to start going long in the face of a downtrending market.
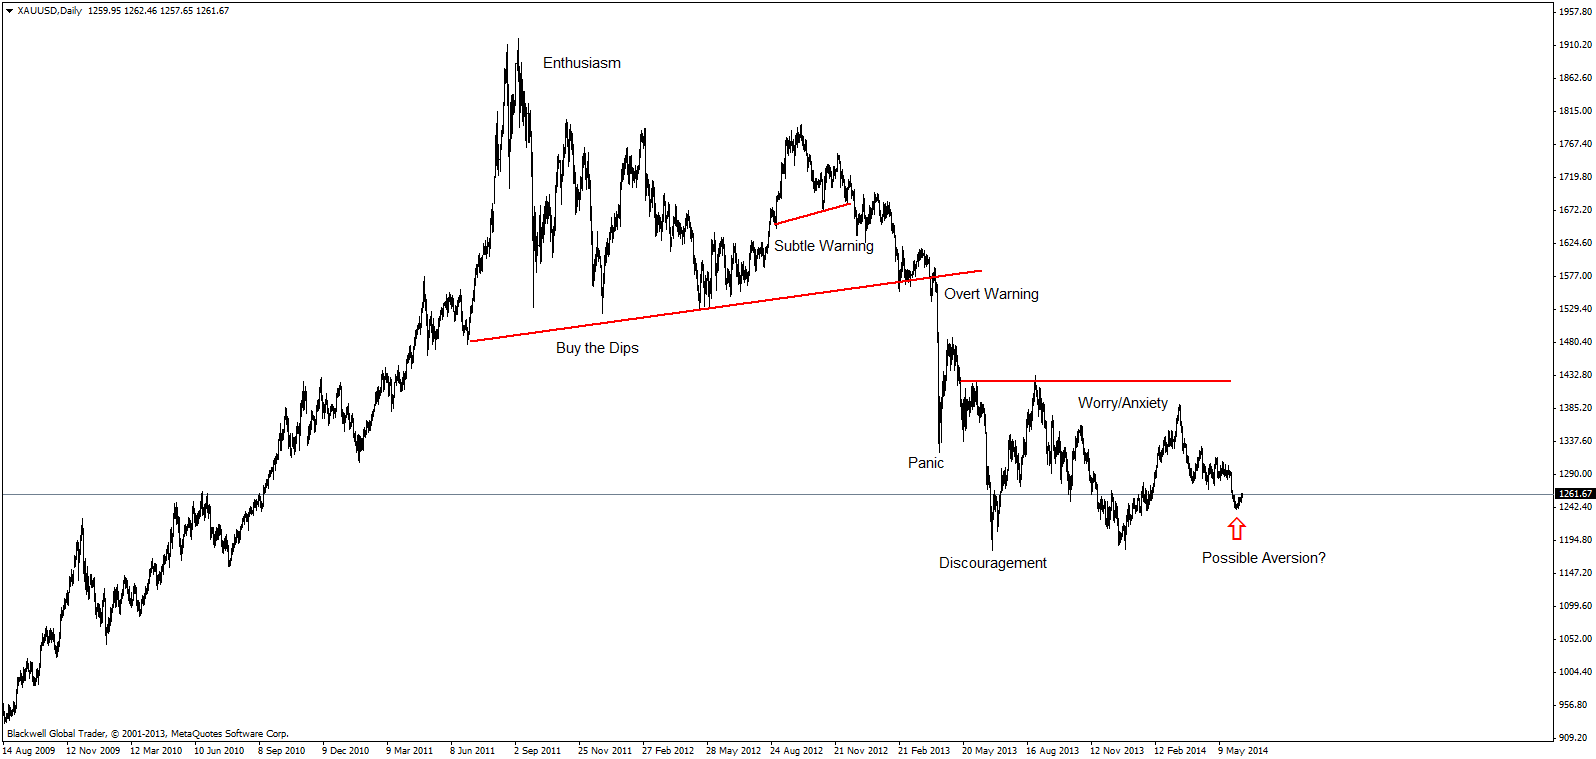
The quick answer would be no, not yet. Aversive moves are often a period of time where short sellers get concerned that the overriding sentiment has changed to a bullish one. The price action supporting this upward move should thus be impulsive with large full bodied bullish candles demonstrating good momentum. So far, the bull candles the past few days are small in relation to the big impulsive bear candles we saw from the fall of March highs.
Chart analysis
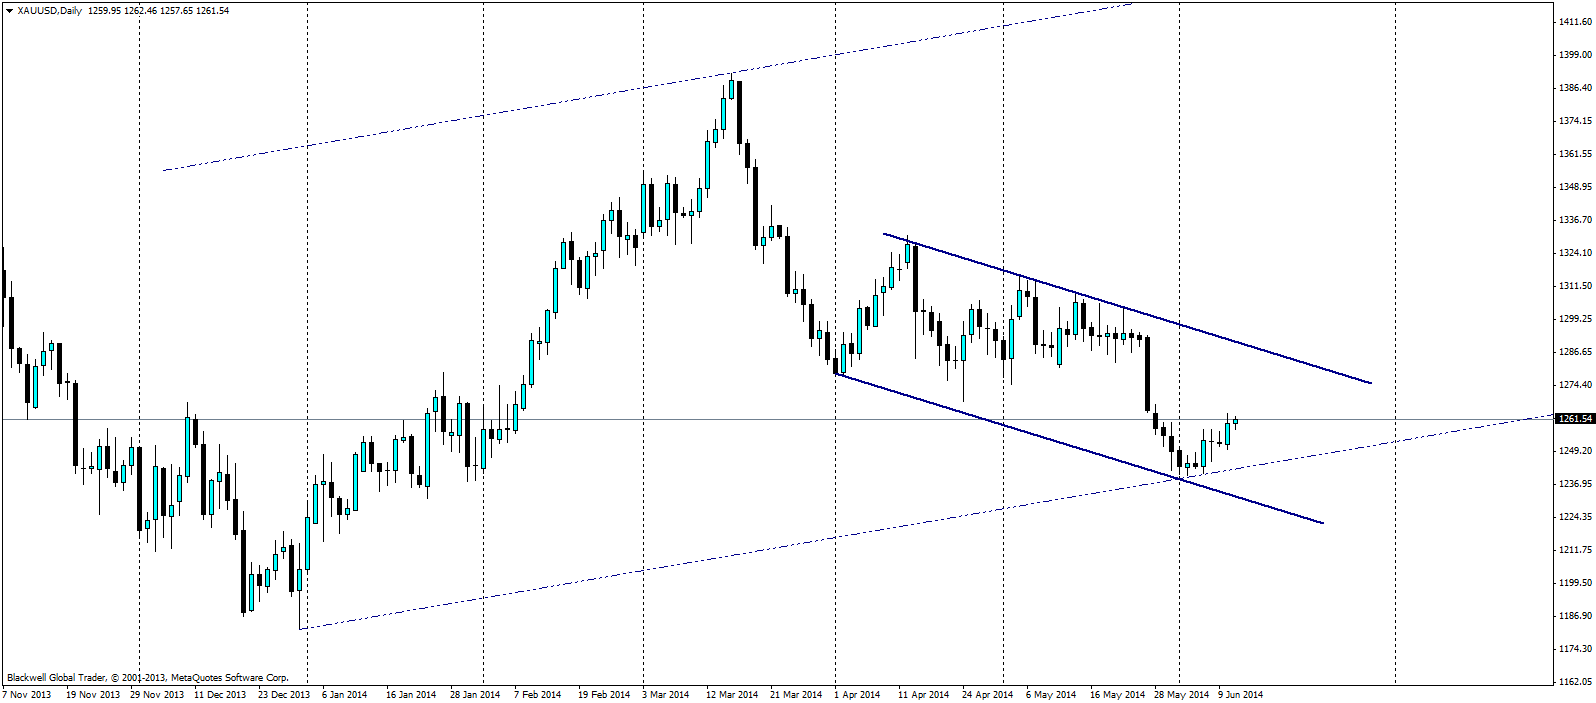
Having said that, since the upward momentum of an aversive move could come hard and fast, I will be keeping a very close eye on the intraday charts for possible opportunities to go long and/or stack longs. Taking a closer look at the D1 charts, I have a mid-term provisional bullish channel (no 2 touches on upper resistance) and a shorter-term bearish channel. Price is currently in an interesting zone.
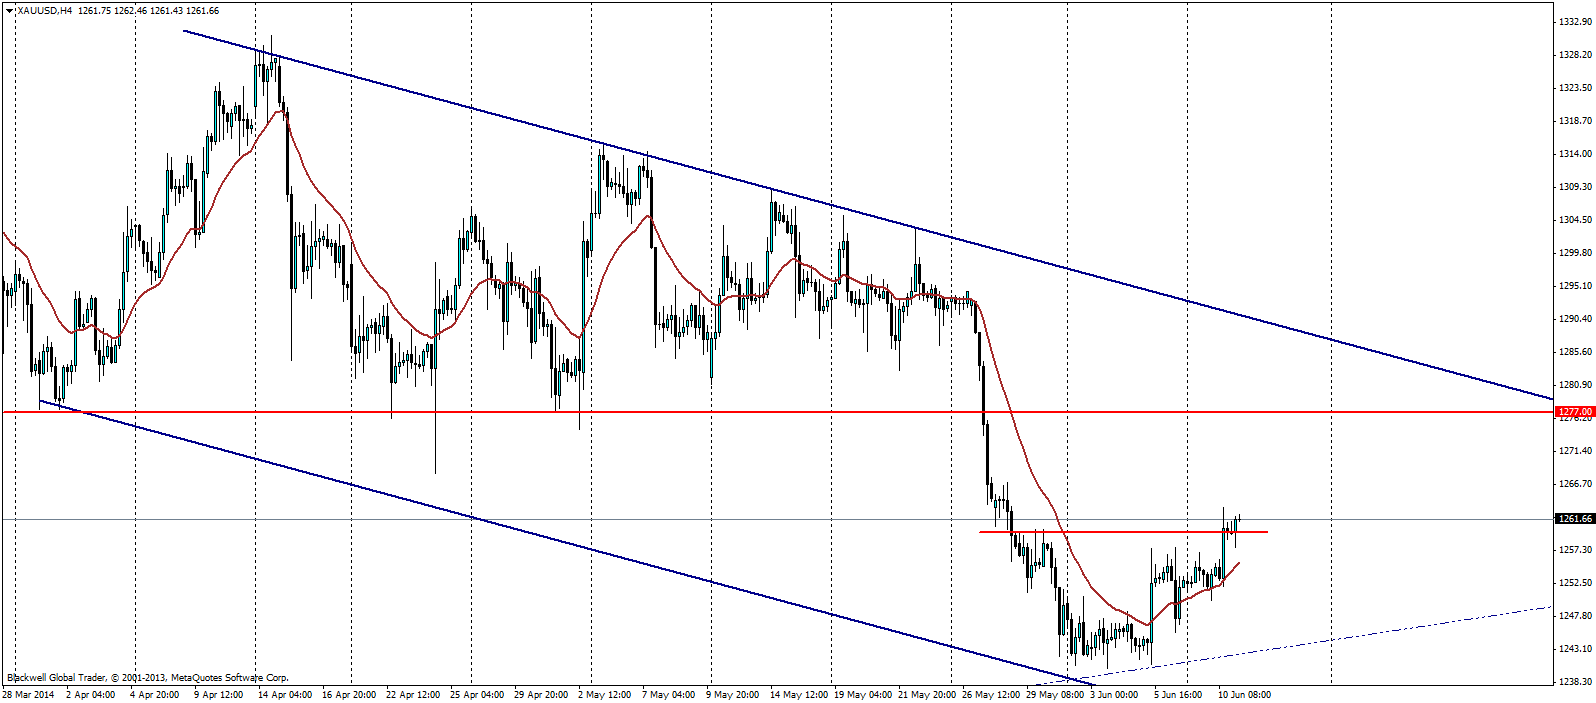
The intraday H4 chartbelow shows a short term bullish trend with the 20EMA acting as a dynamic support. Aggressive traders can look to long at market targeting 1277 to manage their trades, keeping in mind the bigger provisional channel and the sentiment cycle discussion above. More conservative traders can get in on correct pullbacks toward the 1257 area. Keep in mind, we are looking for impulsive moves up and not weaker corrective moves.
Major Gold Mining Company Stocks
Moving away from technical analysis, I would like to bring your attention to an often cited correlation between Gold mining stocks and spot Gold prices. It has been a long standing contention that Gold mining stocks rise before the price of spot Gold does. This contention stems from the idea that industry insiders understand the market they are in better and will buy the asset they have the most knowledge about. Take a look at the chart below of 4 major US gold mining companies’ stock prices as well as the Junior Gold Miners Index to see ashort term bullish bias.
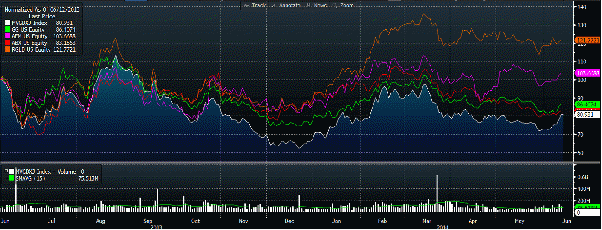
Take note that I am not saying that this chart is a leading indicator on Gold prices. I am just pointing out a potential correlation that makes sense to me on its face. This gives me a context that I can keep in mind when I look to enter positions using technical triggers on either an intraday basis or taking a longer swing position. I hope this article gives you a perspective on trading Gold in the current market.
