Hourly Chart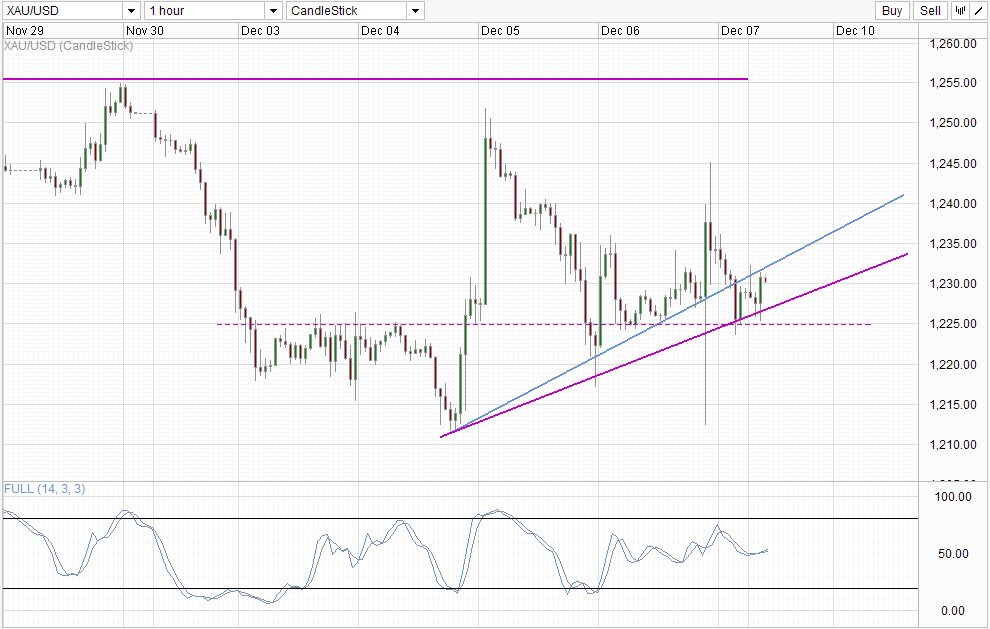 XAU/USD Hourly" title="XAU/USD Hourly" height="629" width="990">
Gold prices took a hit last Friday after US NFP came in much stronger than expected, clearing the 200K barrier necessary for additional QE Taper fears to take flight. However, prices rebounded quickly with gold prices ending up much higher than pre NFP announcement, hitting a day high of 1,245 before tumbling down to 1,225 support for the rest of Friday's trading session.
It should be noted that there isn't any fundamental reason why Gold prices should be trading higher during the period of the spectacular rise, and we are once again leaved with the explanations of "bargain hunters" seeking to buy Gold at a low price keeping prices afloat. Price action supports this assertion, as the quick decline that followed the failed test of 1,240 - 1,245 resistance showed that bullish sentiment isn't prevalent in the market. The fact that the initial NFP decline stopped just around last week's swing low of 1,212 also support the hypothesis, as prices rebound at a typical area where bulls would naturally prime their buy orders. Furthermore, this sort of behavior has been observed last week making it 3 strikes for the hypothesis to float.
That this implies is that we should not be expecting further strong bullish rallies coming out of Gold in the short-term, as it is unlikely that the buyers that have triggered the strong rebound will have enough clout to keep buying indefinitely. Hence, the only way for Gold to continue rally would be if the overall sentiment of the yellow metal has shifted from one of bearish to that of bullish - of which there is no evidence that it is taking place now.
Looking at technicals, depending on how one draws the upward trendline, there will be varied degrees of bearishness. Traders who believe that the blue line has more relevance to price structure will interpret current chart to be more bearish, as this morning's rally have failed to break higher into the rising trendline, which opens up 1,225 as the bearish target once again. On the other hand, traders who prefer the purple line would be looking at a potential move towards 1,245 - 1,255 once again. However, no mater which is your preference, bearish pressure will remain in play below 1,255, and bullish pressure above 1,225.
Daily Chart 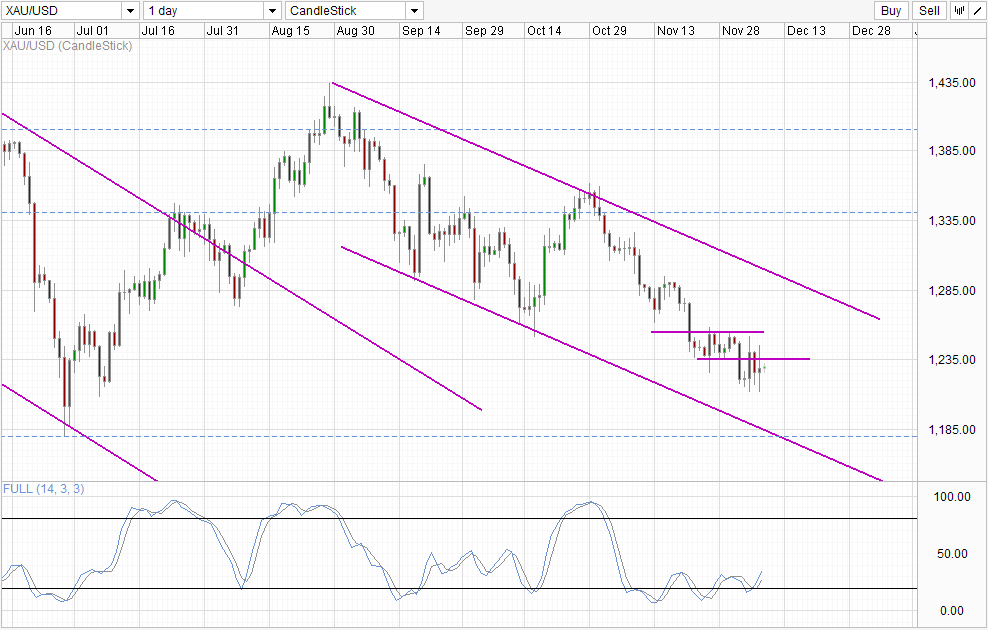 XAU/USD Daily" title="XAU/USD Daily" height="629" width="990">
Daily Chart is still bearish, with Channel Bottom the bearish target. However, Stochastic indicator shows that a short-term recovery cycle may be underway with Stoch curve breaking the "resistance" of 30.0, and opens up a short-term recovery cycle until 50.0 - in concordance with price potentially finding resistance between 1,235 - 1,255. Therefore, short-term bullish movement should not be ruled out even though long-term direction is still bearish.
Original post
- English (UK)
- English (India)
- English (Canada)
- English (Australia)
- English (South Africa)
- English (Philippines)
- English (Nigeria)
- Deutsch
- Español (España)
- Español (México)
- Français
- Italiano
- Nederlands
- Português (Portugal)
- Polski
- Português (Brasil)
- Русский
- Türkçe
- العربية
- Ελληνικά
- Svenska
- Suomi
- עברית
- 日本語
- 한국어
- 简体中文
- 繁體中文
- Bahasa Indonesia
- Bahasa Melayu
- ไทย
- Tiếng Việt
- हिंदी
Gold: Long Term Bearish Outlook Intact Despite Flash Rally
Published 12/09/2013, 12:53 AM
Updated 07/09/2023, 06:31 AM
Gold: Long Term Bearish Outlook Intact Despite Flash Rally
Latest comments
Loading next article…
Install Our App
Risk Disclosure: Trading in financial instruments and/or cryptocurrencies involves high risks including the risk of losing some, or all, of your investment amount, and may not be suitable for all investors. Prices of cryptocurrencies are extremely volatile and may be affected by external factors such as financial, regulatory or political events. Trading on margin increases the financial risks.
Before deciding to trade in financial instrument or cryptocurrencies you should be fully informed of the risks and costs associated with trading the financial markets, carefully consider your investment objectives, level of experience, and risk appetite, and seek professional advice where needed.
Fusion Media would like to remind you that the data contained in this website is not necessarily real-time nor accurate. The data and prices on the website are not necessarily provided by any market or exchange, but may be provided by market makers, and so prices may not be accurate and may differ from the actual price at any given market, meaning prices are indicative and not appropriate for trading purposes. Fusion Media and any provider of the data contained in this website will not accept liability for any loss or damage as a result of your trading, or your reliance on the information contained within this website.
It is prohibited to use, store, reproduce, display, modify, transmit or distribute the data contained in this website without the explicit prior written permission of Fusion Media and/or the data provider. All intellectual property rights are reserved by the providers and/or the exchange providing the data contained in this website.
Fusion Media may be compensated by the advertisers that appear on the website, based on your interaction with the advertisements or advertisers.
© 2007-2024 - Fusion Media Limited. All Rights Reserved.