Four fast figures facts:
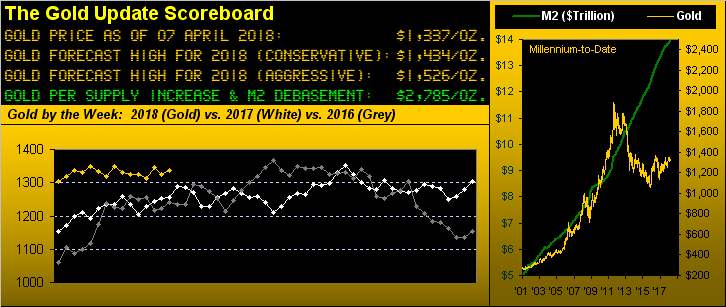
■ As depicted above in the Scoreboard through these first 14 weeks of 2018, gold's weekly closes have been tightly arrayed between 1314 and 1349. That's all: a range of 35 points, (or +2.7% from low-to-high). Thus price sits tight despite so many plights from tariffs and thievery to a stock market ever so shivery.
■ The S&P 500 this year has twice closed weeks in the 2800s, seven times in the 2700s, four times in the 2600s and once in the 2500s, covering a weekly closing range of 284 points, (or -9.9% from high-to-low).
■ Nearly nine years back on 05 May 2009 both gold and the S&P settled at the same price of 904; today, the S&P (2604) is priced twofold that of gold (1337) ... but by this year's weekly closings range, the S&P's points volatility is eight times (284/35) that of gold. "Live by the volatility, ..."
■ Sleepy Sister Silver in settling the week yesterday (Friday) at 16.365 has now been fully-contained in the 16s for 43 consecutive trading days; moreover the gold/silver ratio remains above 80x.
What's it all mean? The once Great American Savings Account on occasion reminds us 'tis not always that which it seems: the S&P rightly "corrected" by better than 50% in the years 2000-2002 and 2007-2009. Now 'tis again losing its shine, although perhaps by not as much this time; we'll again review at the -25% line (S&P 2154). Meanwhile gold, the over-arching savings account for all time, quietly sits with a nod and a wink to Sister Silver for her to lead out on the next precious metals climb.
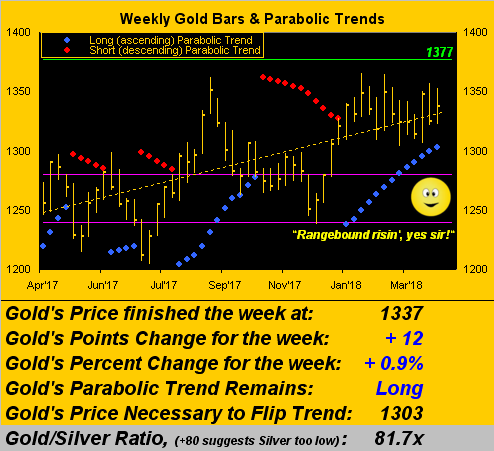
But does gold climb from here, or is the end of this weekly parabolic Long trend near? For our doting dot counters out there, the present ascent of blue dots numbers 13 weeks: that's but half of longest Long run millennium-to-date of 26 weeks (June-December in 2005), which itself is one of five mutually-exclusive upside runs of 20 or more weeks since 2001. To be sure, as we turn to gold's weekly bars, the tight range year-to-date stands stark: quite zany 'tis given all the other markets' disruptions over this plight and that. But we'll take the graphic's rising dashed trendline versus being stuck within the purple bounds of The Box (1280-1240) every time; (and, per a valued reader's recommendation, we've added to the stats the gold/silver ratio when +80x):
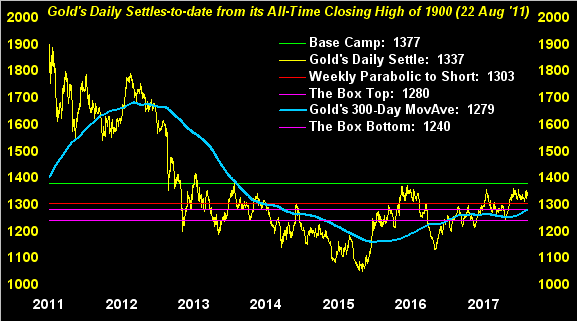
More broadly, here we've gold's daily closes since its highest at 1900 back on 22 August 2011. Note the nice upward bending of late by the 300-day moving average, indicative of price being at least more buoyant rather than burdened. Again ad nausea, 'tis all about taking out Base Camp 1377 (the green line) for the run then to at least 1434, (our conservative forecast high for this year):
Not so nicely downward bending is the Economic Barometer: and just in time for two if not three more rate hikes this year from the FOMC? Well, maybe not. You know how it always goes: the Econ Data weakens, as ought follow the stock market, and the members of the Federal Open Market Committee put themselves on sympathetic hold, which ought redound quite well for gold. Either that, or the March payrolls growth malaise shall be discarded due to "nor'easters" so they say. For after all, anything south and west of New England is but barren land. Still, where might the Econ Baro land? Here's our latest view firsthand:
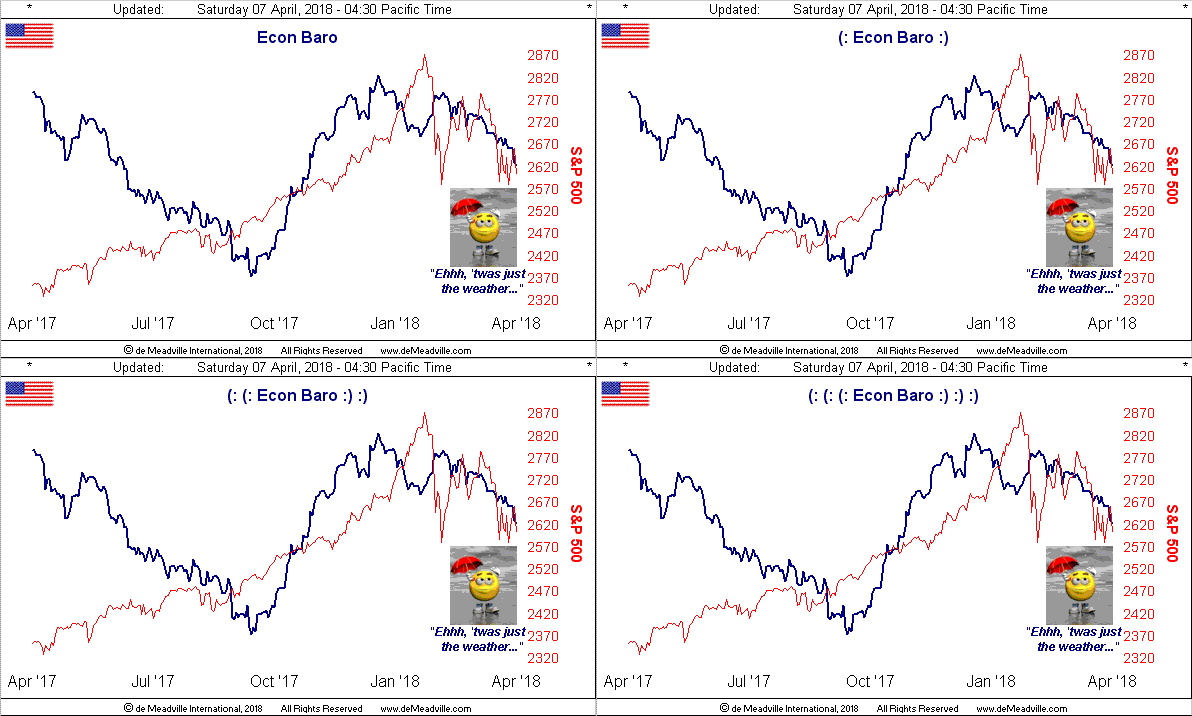
At least one stalwart cornerstone of the FinMedia has finally picked up on the economy's lacking grippity, the venerable Wall Street Journal running this past week with a piece entitled "Growth Slowed Across Most of U.S. Economy in March". Glad to see you lads gettin' with the program out there, with what the Baro already has been indicating year-to-date. Hopefully someone will alert our own San Francisco hawkish FedHead John Williams as he heads eastward to next head the New York Fed ... below which and beneath the clattering subway trains is stored (so 'tis said) in excess of $300 billion in gold bullion. Mind the store carefully, Sir Hawky.
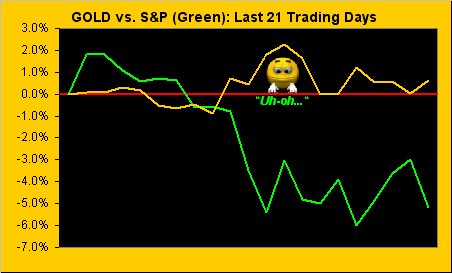
In any event as from day-to-day we hear of plights all 'round from which gold ought abound, 'tis rather staying just above ground. Here for the past 21 trading days (one month) we've the percentage tracks of gold vs. the S&P:
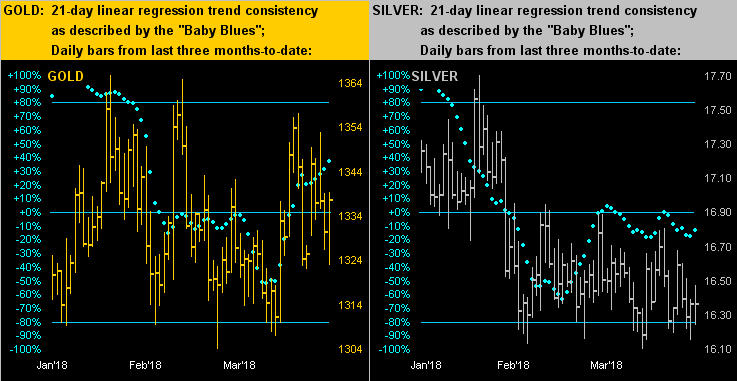
Indeed, from the "Can't Get Out Of Its Own Way Dept." let's next view in our two-panel display the daily bars across the last three months-to-date for gold on the left and silver on the right. And therein, peruse the "Baby Blues" which track each day's consistency reading along the 21-day linear regression trend: rather than see the "rule" of the blue dots oscillating up and down from the +80% to -80% levels, we have instead an incongruous mess, gold saying "I feel like I'm going up but not really..." and Silver exclaiming "These knickers refuse to untwist!":
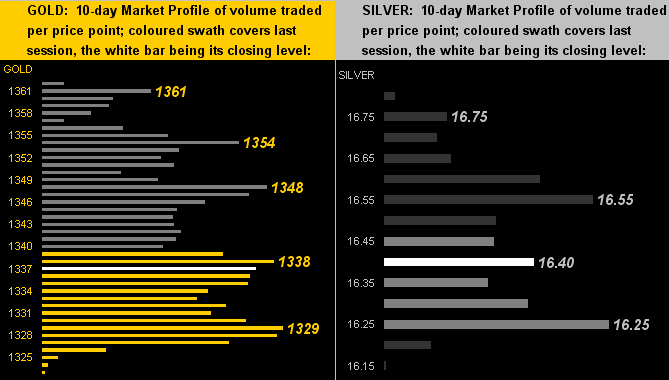
In turn, narrowed messy markets lead to multi-apex 10-day Market Profiles as we next see for gold (left) and Silver (right). Time for our precious metals to ignite given so many plights!
In closing, divide something into two and we say 'tis been "halved". Or having "quartered" that slab of beef you've now four lovely fillets. But to separate one thing into threes? Has it been "thirded"? Or perhaps "tertiled"? Does it matter? It does to the party who back on 18 December paid over $20,000 for one of those invisible Bitcoins, given that price has since been "thirded" in settling out this past week (per the CME) at $6,590. As was the case for tulips, to be again "tertiled" from here would be a return to last summer's $2,000s, at which point might one rightly say 'tis been "ninthed"? Put that in yer Funkin' Wagnalls ... or better yet, instead think twofold and just get some gold!