Sentiment and Positioning
When we last discussed the gold sector correction (which had only just begun at the time), we mentioned we would update sentiment and positioning data on occasion. For a while, not much changed in these indicators, but as one would expect, last week’s sharp sell-off did, in fact, move the needle a bit.
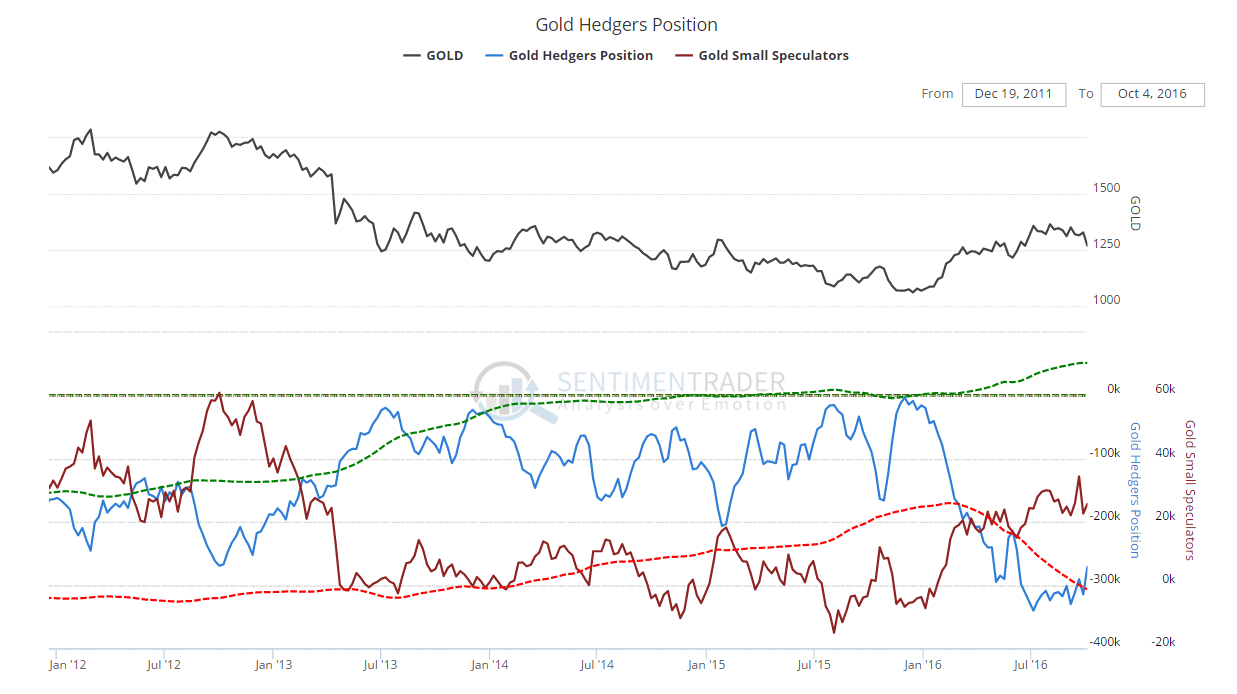
The commitments of traders (CoT) report of Friday shows us the situation as of Tuesday last week. The net hedger position shown in the chart below is the inverse of the total net speculative position. In addition, the chart includes the net position of small traders:
At its current level of 271,000 contracts net, the total net position of speculators in the legacy CoT report is down approx. 70,000 contracts from its high in early July. A bigger shake-out may be required, but the enthusiasm of small traders (red line, rhs) has already been dented quite a bit.
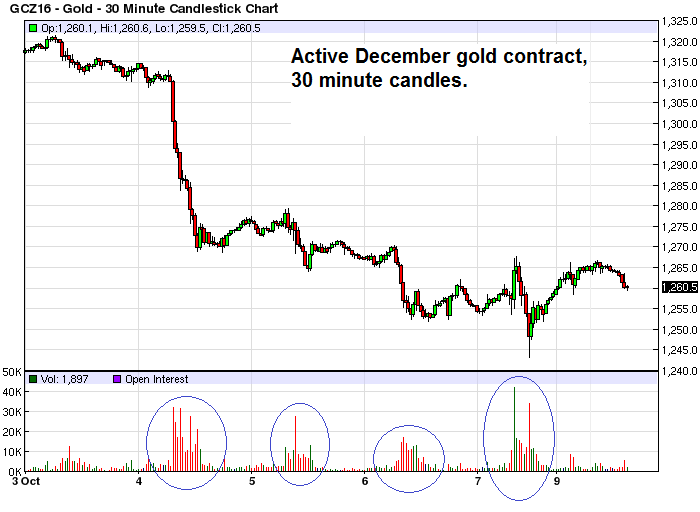
The bulk of the price damage was in fact done on Tuesday, and volume was quite chunky as well. Volume continued to be very large over the remainder of the week though, so it is probably fair to assume that there have been further shifts in the net speculative position since then. Below is a 30-minute chart of last week’s action in the most active December contract that includes trading volume.
Last week’s trading in the December gold contract. Volume remained elevated throughout the week, with especially large spikes seen on Friday after the payrolls report.
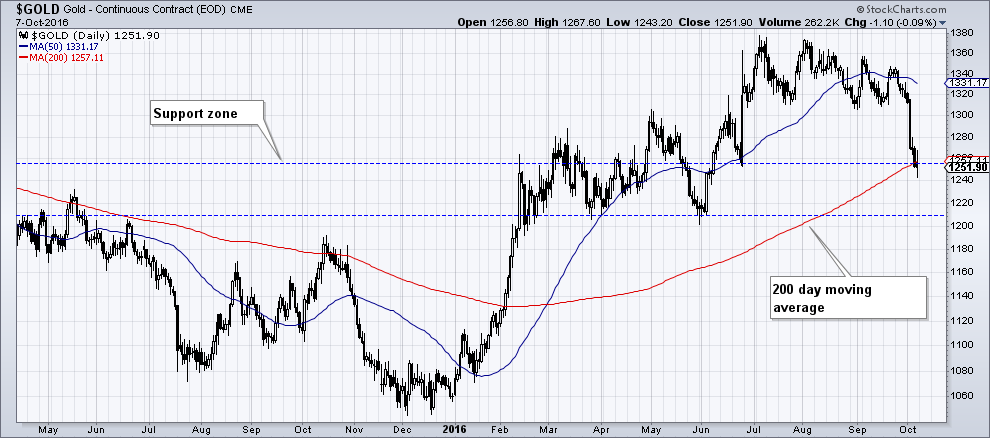
On a daily chart of gold it can be seen that prices have just hit the upper boundary of a support zone, which happens to coincide with the 200-day moving average. One can probably expect that at least a bounce will develop from here, especially as gold has gone down nine days in a row as of last Friday.
Note also: the 200-dma is currently rising, which distinguishes this pullback from similar sell-offs seen during the 2011 – 2015 bear market phase. It is quite normal for a new bull market to revisit (and even briefly undercut) its 200-dma from time to time, especially after it has spiked to levels far above it.
The CoT data shown above have already suggested for some time that such a shake-out would eventually have to happen.
Gold daily – the gold price reaches a support zone as well as the currently rising 200-day moving average.
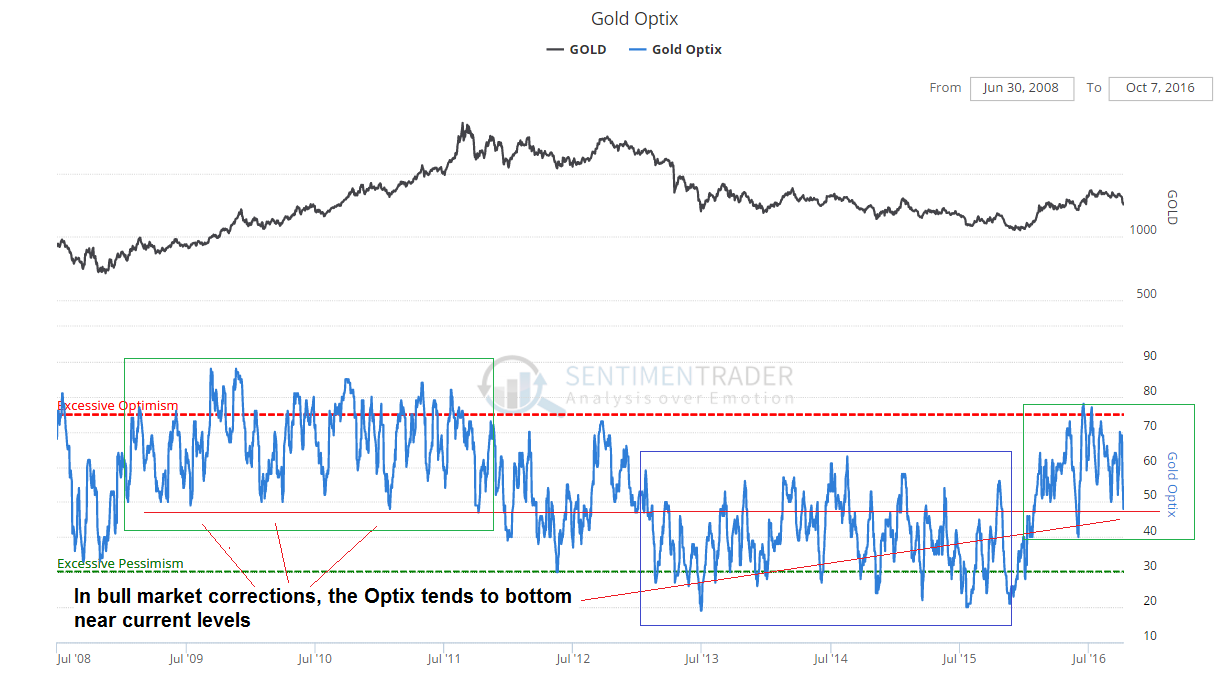
This is actually quite interesting when brought into context with the next chart, namely sentimentrader’s gold optimism index, or OPTIX for short. The OPTIX is an amalgam of positioning data and the most important survey data. We have previously commented on this index and pointed out that it tends to move within certain ranges during bull and bear markets. Just as gold has met with its 200-dma, the OPTIX has hit the lower level of its traditional “bull market range”:
The gold Optix is now right at the level that usually serves as “support” during bull markets. As can be seen above, during bear markets, the Optix tends to fluctuate in a much lower range.
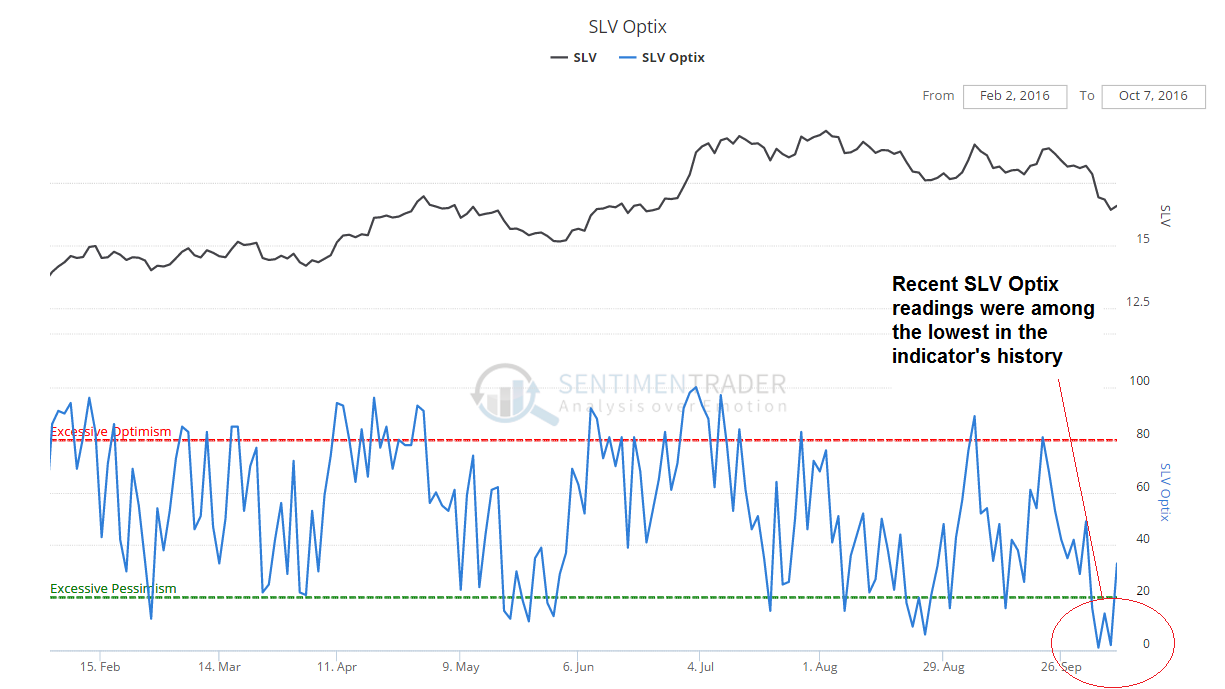
We have come across an interesting comment by Jason Goepfert (who runs sentimentrader) in this context. With respect to the silver ETF SLV, he noted last week:
Among the funds that we follow, the Optimism Index on SLV has averaged 6 over the past three days. In its history, the 3-day average has been this low only four other times: 2008 (twice), and 2011 (twice).
Here is a chart showing the daily SLV OPTIX. At one point last week, the indicator had declined to a reading of just 1, which is to say, only 1% of market participants remained short-term bullish on the ETF. Obviously, it cannot go lower than zero.
At one point last week, SLV was almost entirely bereft of bulls.
We must stress that this reading is only relevant for the short term, but it is nevertheless quite remarkable. How often are bulls deserting a listed security completely? We have occasionally seen 5% readings in the Daily Sentiment Index (DSI) in the past, and once even a 3% reading (this was on the S&P 500 futures contract at its crash low in March 2009). But this is the first time we see such an indicator at just 1 – followed two days later by a somewhat higher reading of 2.
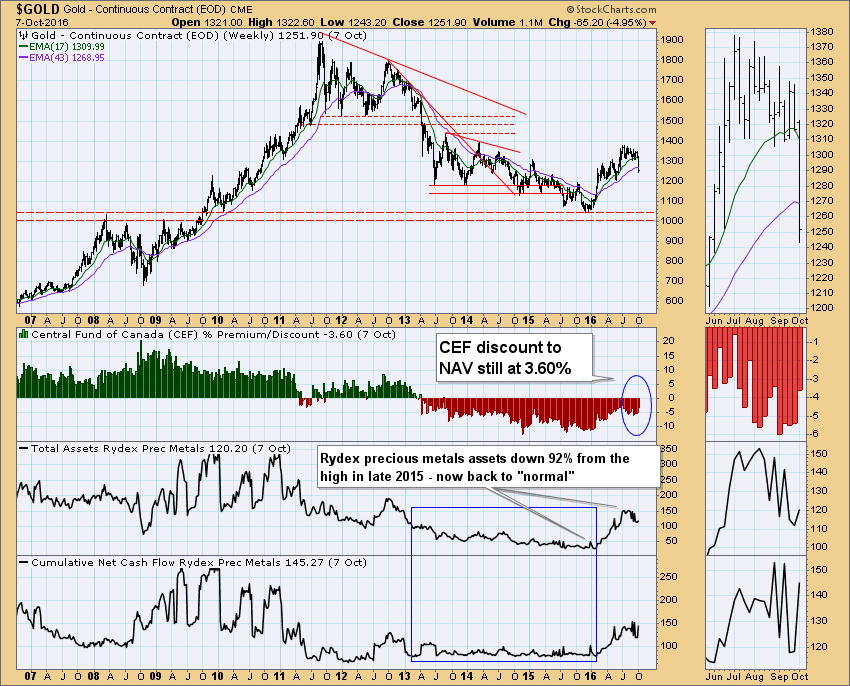
The next chart shows the CEF premium/discount to NAV over time (CEF is a fund that holds both gold and silver bullion), as well as Rydex precious metals assets and cumulative cash flows. The former remains at a discount to NAV, while the latter have just moved up from their previous bearish extremes to more “normal” levels, but by no means to levels associated with foaming-at-the-mouth bullishness.
Gold vs. CEF’s price to NAV as well as Rydex precious metal fund assets and cash inflows.
In summary, we would say that while there may still have to be more work done with respect to futures positioning, the data are so far perfectly in line with what is occasionally needed to keep a bull market alive. Market action now and then needs to create just enough doubt to dispel complacency and keep market participants on their toes.
Obviously, this does not guarantee that a bear market won’t develop; but it is still precisely what is required for a bull market to catch its breath, so to speak. Admittedly, gold fundamentals are at best “mixed” in the short term, but the long term case for gold has not changed one bit.
The “trigger”, or rationale for the recent sell-off is the recent increase in odds of a Fed rate hike in December. In the bigger scheme of things a 25 basis points rate hike matters little of course. Or let us rather say, it matters only insofar, as it will bring the bursting of the bubble in stocks and bonds one small step closer. This in turn would definitely not be bearish for gold.
In fact, gold tends to do well when the markets begin to sense that liquidity is evaporating. Gold then begins to very quickly reflect growing expectations that central banks will soon engage in monetary pumping again to counter the decline in asset prices.
Lastly, from an anecdotal perspective, we note that the media were flooded with bearish articles on gold last week. From “the bear is only just beginning” to our favorite “there never was an uptrend” (let’s just ignore the 180% rally in gold stocks…), people who for the most part previously neglected to mention that there would be a rally were suddenly very eager to warn everybody of its demise.
Jason Goepfert gave an interview to Marketwatch, which we found quite amusing as well. It appeared under the lurid title “Gold just collapsed below a key technical level”. Goepfert noted that statistically, gold does better when it is above its 200-day moving average than when it is below it (surprise!). If you look at the daily chart of gold further above again with a microscope, you will notice that it actually dipped slightly below the 200-dma late last week.
The Marketwatch author concludes that this obviously “doesn’t bode well” for gold. What makes it funny is that Goepfert actually elaborates that the “signal” (a dip below the 200-dma from above) has exactly the same predictive power as a coin flip, this is to say, none at all.
Gold Stocks
As we have mentioned previously, most investors actually missed the first 100% or so of the rally in gold stocks (see: “A Historic Rally in Gold Stocks – And Most Investors Missed It” for the details). This was probably the main reason why the rally proceeded to extend further, to reach a peak approximately 180% above the January low in the HUI index.
The strength of the move surprised even the bulls, as we can attest to. It was clear though that a sizable correction would have to follow in its wake. On September 1, we discussed the beginning of the correction in the sector (see “Gold Sector Correction – What Happens Next”).
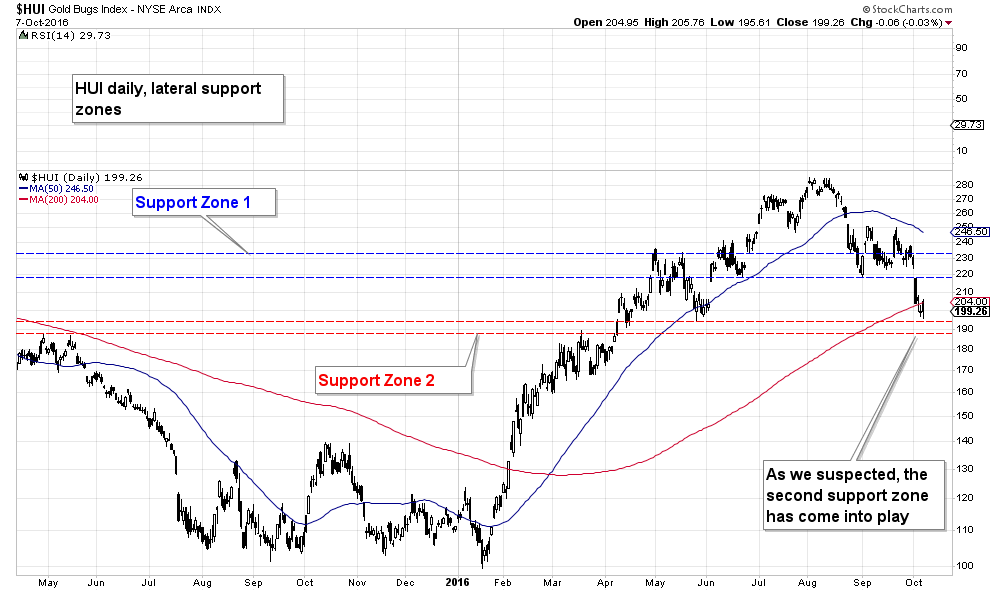
Below we show updated versions of the charts we posted on that occasion – from the daily to the monthly perspective. The daily chart shows that the second support level we flagged has now basically been reached. This also suggests that we will soon see a short term bounce at a minimum, particularly in light of the speed and severity of the correction (which is not unusual for the gold sector). Note: all data are as of Friday’s close.
The HUI at first bounced from the first lateral support zone and then broke down to reach the second one, close to the 200-day moving average. There could still be some more near term weakness down to around 190, but the support area marked by the red dotted lines is very likely to become a springboard for a short term retracement rally.
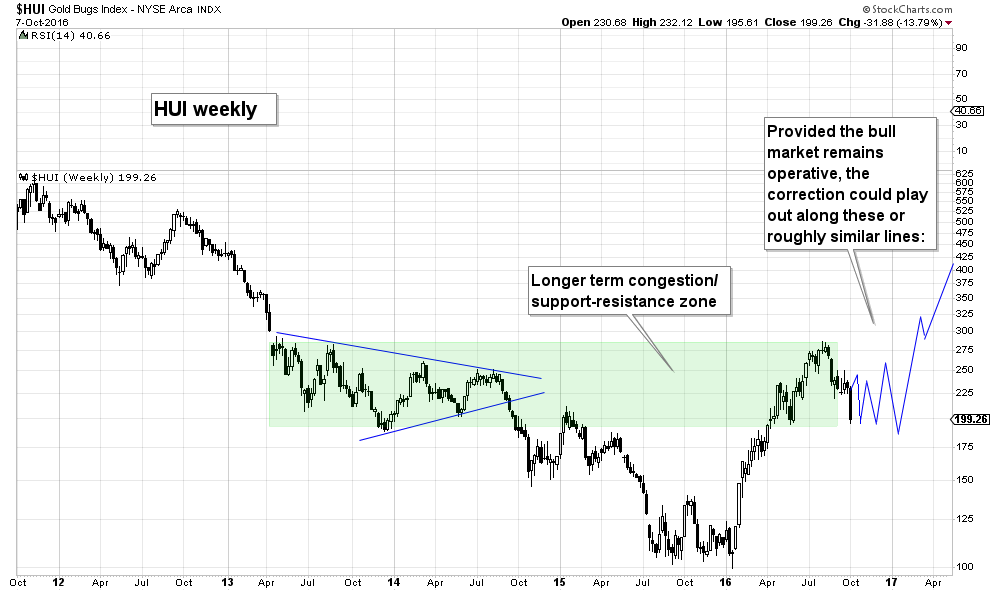
Even if such a short term rally develops from here, one has to keep in mind that the overall corrective process is probably not finished yet; this is likely to take more time. On the weekly chart we have penciled in a possible path – under the assumption that the bigger-picture bull market remains intact.
The HUI has now reached the lower boundary of a longer term congestion zone, but even if the bull market is set to continue, it seems likely that a more complex and drawn-out correction will play out before it resumes.
In light of the still large net speculative position in gold futures, one also has to remain open to the possibility that the correction could eventually become more extensive in terms of prices. We think this scenario has a lower probability than the one shown on the weekly chart above, but it cannot be ruled out entirely.
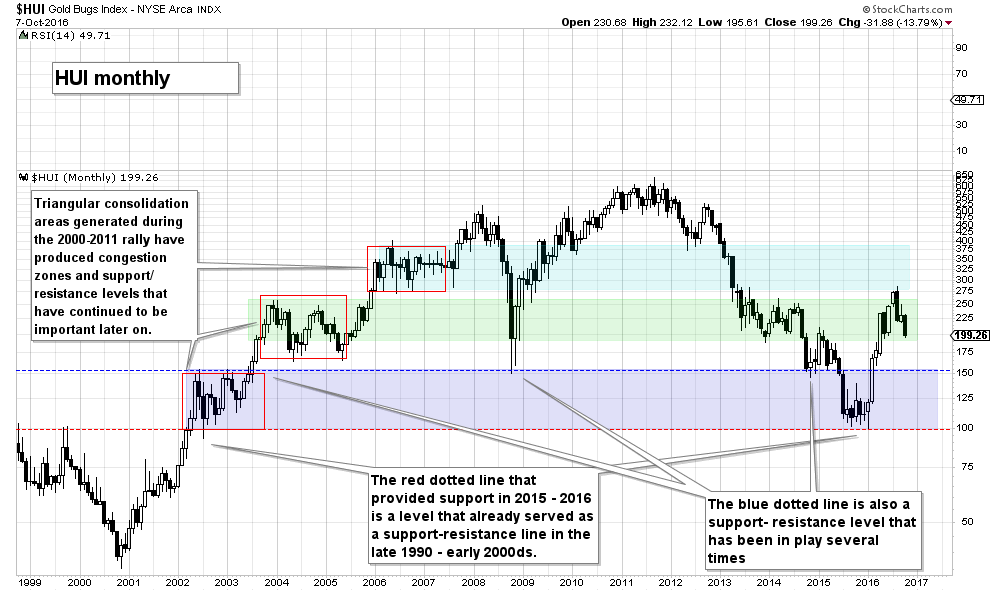
The monthly chart is helpful with determining the next major lateral support level. Per experience, very long term support/resistance levels tend to be quite important for the HUI Index.
On the monthly chart of the HUI we want to draw your attention to the blue dotted line,the upper boundary of the lowest consolidation zone shown here, which provided resistance in 2002-2003 and support in 2008. We don’t expect the index to fall that far in the current correction, but if it does, it should not fall any further if the recent move is indeed the beginning of a long term bull market.
In summary, we think the sector is quite close to a retracement rally, but there will likely be further ups and downs before the bull market actually resumes. We would also say that the probability is very high that the 190 – 200 level will contain the price damage of this correction, but an even deeper retrenchment still remains possible.
If the 190-200 level holds, the size of the correction would be more in line with the size of previous bull market corrections though, so this would actually be the preferable outcome if one is bullish.
Conclusion
The gold sector hasn’t done anything untoward yet. Everything that has happened so far remains in line with normal corrective activity. Investors will likely have to exercise patience though. Corrections of this size are usually multi-month affairs, even if the underlying primary trend remains intact. For those who have missed the rally earlier this year, a low risk opportunity presents itself here (low risk because one an limit the risk with tight stops based on nearby support levels).
Charts by: SentimenTrader, BarChart, StockCharts

