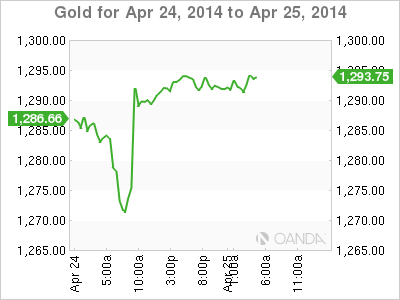
Gold prices are steady in Friday trade, with a spot price of $1293.58 in the European session. The metal dropped below $1270 on Thursday but bounced higher after deadly clashes in Ukraine. In economic news, today's highlight is UoM Consumer Sentiment. The markets are anticipating an improvement in the March release.
Gold has been under pressure throughout the week, thanks to strong confidence in the US economy. However, the metal posted gains on Thursday following reports of casualties in fighting in the Ukraine between government forces and pro-Russian militias resulted in casualties. The situation is very tense, and there are concerns that the US could be drawn into the conflict if Russia attacks Ukraine. In the meantime, the US and Europe continue to threaten Russia with further sanctions if the crisis escalates.
On Thursday, key US releases pointed in both directions. Unemployment Claims jumped to 329 thousand, its highest level since mid-February. This was much higher than the estimate of 309 thousand. There was much better news from the manufacturing front, as Core Durable Goods Orders jumped 2.0% in March, crushing the estimate of 0.6%. This was the key indicator's best showing since September 2o12. Durable Goods Orders kept up the fast pace with a sharp gain of 2.6%, beating the estimate of 2.1%.
The US housing sector continues to sputter. New Home Sales was a disaster, as the key indicator plunged to 384 thousand in March, down from 440 thousand in the previous release. The weak reading was nowhere near the estimate of 455 thousand, and marked an eight-month low for the key housing indicator. Existing Home Sales has also been on a sustained downward trend. The indicator edged lower in March to 4.59 million, although this did beat the estimate of 4.57 million.

- XAU/USD April 25 at 8:45 GMT
- XAU/USD 1293.78 H: 1294.69 L: 1290.45
XAU/USD Technicals
| S3 | S2 | S1 | R1 | R2 | R3 |
| 1241 | 1260 | 1273 | 1300 | 1315 | 1330 |
- XAU/USD has steadied on Friday following gains a day earlier. The pair touched above 1294 early in the European session.
- On the downside, 1273 has some breathing room as the pair trades at higher levels.
- 1300 is the next resistance level. This line could see some pressure if gold prices continue to climb. This is followed by resistance at 1315.
- Current range: 1273 to 1300
Further levels in both directions:
- Below: 1273, 1260, 1241 and 1215
- Above: 1300, 1315, 1330, 1350 and 1388
OANDA's Open Positions Ratio
XAU/USD ratio is pointing to gains in long positions in Friday trade. This is consistent with the pair's current movement, as gold has posted slight gains on Friday. The ratio has a substantial majority of long positions, reflecting a strong trader bias towards gold moving higher against the dollar.
Gold prices have rebounded, as the pair trades above 1293. XAU/USD has posted gains in the European session.
XAU/USD Fundamentals
- 13:45 US Flash Services PMI. Estimate 56.2 points.
- 13:55 US Revised UoM Consumer Sentiment. Estimate 83.2 points.
- 13:55 US Revised UoM Inflation Expectations.
