And good behavior ought to be properly rewarded as Gold near-term had the discipline to get back in sync with itself by rightly putting in a delightfully down week as was herein prescribed in our prior piece. "Delightfully" so because the week's ebb was perfectly normal, albeit I see price still working a bit lower, the degree to which we'll herein discuss.
Yet as too often had been the excruciating case this year, this time 'round there were no midnight beasties hoovering thousands of underlying bids, nor wee-hours' poltergeists jamming price down by dozens of points in mere seconds, nor naughty "nattering-nabab" shenanigans by the sinister Shorts. Further evidence perhaps as we wrote last week that "the Bears may be losing their 'control' over the market." Remember: 'twas just back on 15 October that an attempt to drive price sub-1250 failed, indeed to then have Gold zoom up better than 100 points over seven sessions, finding itself instead above 1350 on 24 October. (You weren't Short, were you? No.)
But especially for those of you paying attention from the broad-term perspective, the yellow metal per Friday's settle of 1316 remains terribly low, given all that we know which makes Gold go. However, having risen from low-to-high by 8% over the preceding two weeks had placed Gold reasonably far afield of its Market Magnet, to which price regularly returns as the following animated graphic shows, per extending the picture last seen one week ago, day-by-day to the present. Price itself is the thin line; the thick line in the upper panel is the magnet, its latest level being the boxed number; and the lower panel depicts price's distance from the magnet, again that latest difference in the box. Per Roger Moore in his opening scene debuting as 007 in 'Live and Let Die' (Eon Productions, 1973): "Sheer magnetism darling..."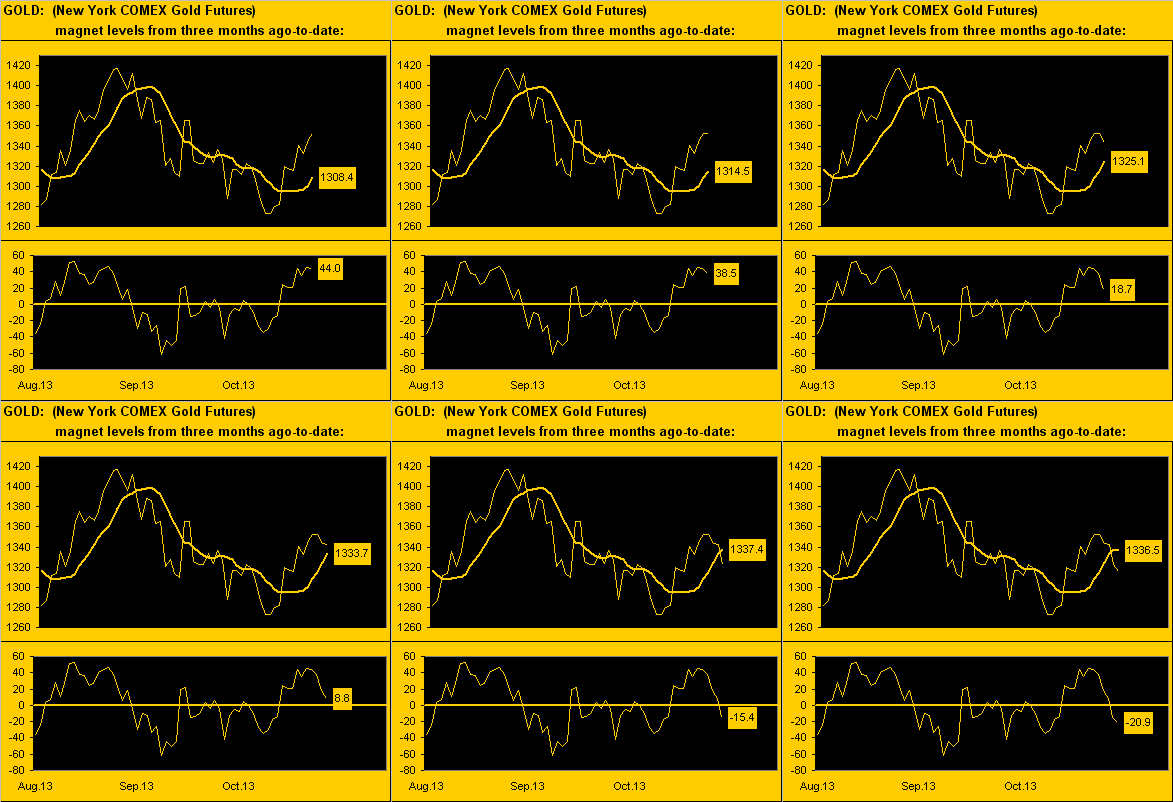
Does this assert that the short-term spate of Gold's being sold is complete? Similar to the trader's rule-if-thumb for being positioned in the direction to which price is traveling when crossing its Market Value line, 'tis the same when crossing its Market Magnet. Therefore, Gold having penetrated under the magnet suggests lower levels still, to the extent below which price does not stray too far, (else 'tis then back "up" to the magnet). However, also recall from last week's missive the notion that a move down to Gold's Market Profile support apex at 1317 would be just fine; although 'twas overshot during yesterday's session to as low as 1306. Yet look to where Gold then returned to close out the week: 1316. Not bad.
As for the aforementioned Market Value, here 'tis going back for a full year, the smooth pearly valuation line a function of price movements in the BEGOS markets (Bond/Euro/Gold/Oil/S&P) relative to Gold itself. The downside penetration just recorded yesterday, again by that "rule-of-thumb", would now have the trader positioned Short, (not me). Moreover, in the oscillator portion of the chart (price-less-value), the amplitude of the downside troughs has become more shallow, the rising green line suggesting the relentless pounding of price has become passé: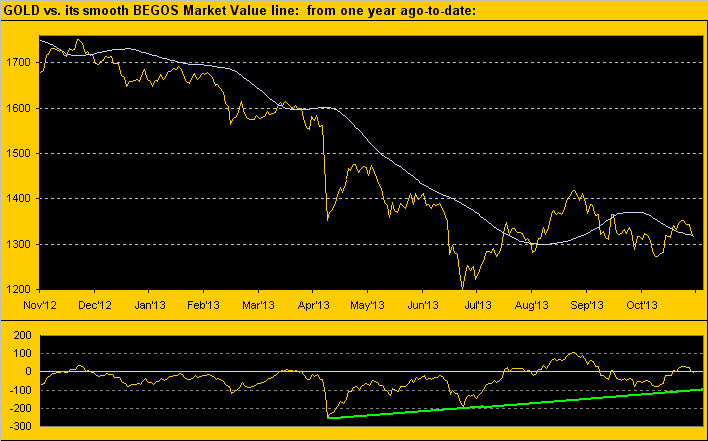
Nonetheless as we turn to Gold's Weekly Bars, the parabolic trend remains Short, price currently near the low of the prior week. But the hurdle to flip the pattern to Long is now down to 1413, just 51 points above the week's high. Given that Gold's "Expected Daily Trading Range" (EDTR) is currently 23 points -- and on a weekly basis is 63 points -- things could well whirl right back up in a hurry: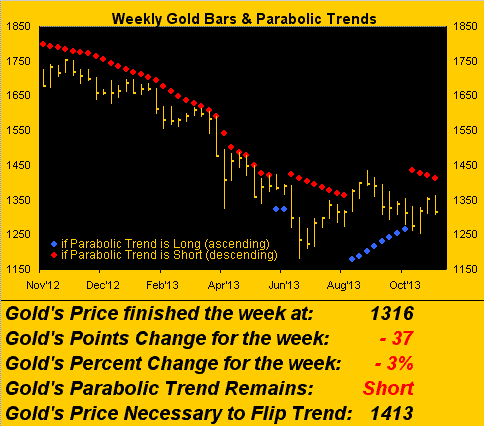
Indeed should the current Short trend shown above of four red dots not ultimately exceed the prior Long trend of eight blue dots, 'twill be fair to say that Gold will have finally resumed its broadest-based trend, which naturally by the continued debasement of currencies is up. To wit, lose thee not sight of Gold when portrayed logarithmically; here 'tis since '02: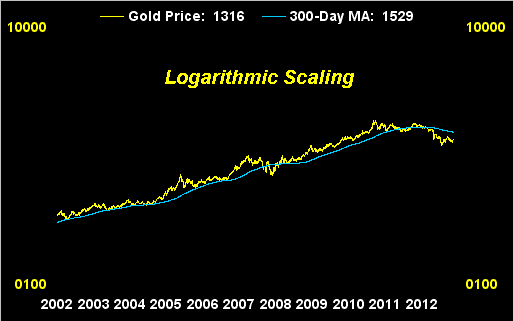
And if we're past the best that the Bears can muster, as Gold just may be preparing to make a run back up to the 300-day moving average (1529), what appears above as nothing more than a two-year logarithmic siesta may be coming to an end.
Nevertheless, or perhaps better stated, "alwaystheless" have been the poor old miners, as we turn the monthly calendar to November and thus update these year-over-year daily percentage tracks: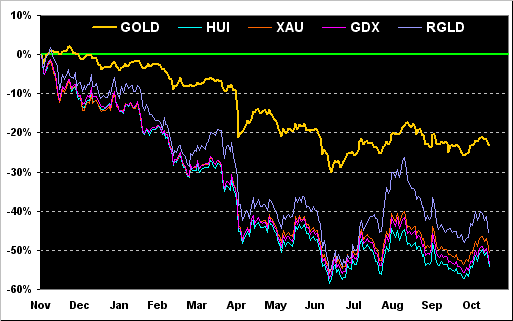
Each of the HUI (Gold Bugs Index), XAU (Philly Precious Metals Index) and GDX (exchange-traded fund for the miners) are off from this date of one year ago by better than 50%. 'Tis more than twice the distance down as is that for Gold (-23%). In the midst of it all is the royalty company RGLD (Royal Gold), which regularly has surged up and away from the miners, only to submerge back to their depths. Still, one must acknowledge that during Gold's recovering 13% of year-over-year loss from late June through most of August, RGLD alone reclaimed better than double that in rising 28%. 'Tis upon that notion the paper-holding believers stay the course. But as sang Marvin Gaye and Tammi Terrell back in '68: "Ain't nothing like the real thing, baby..."
And the real thing from a quantitative perspective for Gold is that its 21-day linear regression trend, despite the week's drop in price, remains up. This is because the baby blue dots in our next chart are above their 0% horizontal axis: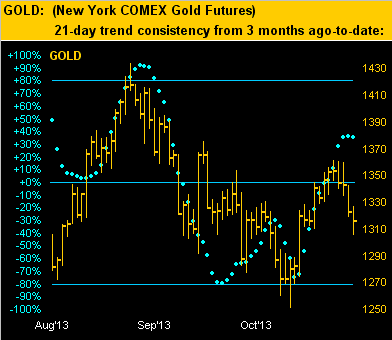
To be sure, the "Baby Blues" represent the ~consistency~ of the linreg trend, which at the moment is obviously not all that consistent, the dots having at least momentarily stalled at just the +35% area. In fact if you look carefully, the most recent dot is just slightly down. Generally when the Baby Blues change course, there is (per our of testing of this daily measure for better than 10 years) continued follow-through of price in that direction. Thus as suggested via our prior charts wherein price has just downside-penetrated both the magnet and valuation lines, this down-kink in these blue dots ought prepare us to expect some degree of lower levels.
"But by how much, mmb?"
I do not think by too much, Squire, primarily because my sense is the broader-based tide has begun to flow more than ebb. The parabolic Short trend at which we earlier looked on the weekly Gold bars may itself be short-lived, given the current ranginess as noted. Let's bring up Gold's Market Profile to see where we stand: 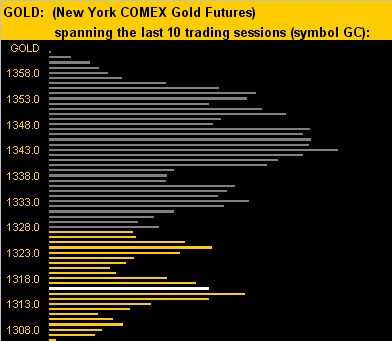
The white bar is Gold's current level of 1316, the lengthiest bar in the bunch being at 1343. Below the minimum of that 10-day chart lies further trading support in the 1281-1271 band. Thus were Gold to briefly drop sub-1300, I shan't think it to move below such support, again should the tilt of the broader trend be pivoting higher. Besides, with respect to Old Yeller's expected confirmation this month to be the next Head of the Fed, as Forbes put it with such tactful eloquence this past week: "Janet Yellen Stands For Something That Has Never Worked":
Which of course for Gold works very well and shall continue to so do once more cranial light bulbs are lit.
The EuroZone too remains monetary accommodative. 'Twas barely a week ago that things were actually starting to appear better even in Spain of all PIIGS' places. But just days later it now appears that Europe has gone from "yo-yo" to "oh-no" as with its joblessness holding steady at 12.2%, 60,000 Europeans lost jobs in September compared to August along with inflation measures establishing four-year lows: where hath gone all the printed Euros? At the very least this is the impetus for an ECB rate cut, although 'tis said that Signor Draghi is running out of options with which to battle were deflation to ensue, which if followed by a depression would actually be a Gold negative. But why shrink if you instead can print? (nudge-nudge, hint-hint, elbow-elbow).
So as we look to the week ahead, which again is chock-full of incoming economic data as the government continues to play catch-up, (not to be fully completed until Thanksgiving Week), I see Gold dipping "a little bit more" but not "a lotta bit more". And if you've been keeping an eye on our Market Rhythm performances, you'll note that nine of the last ten MACD (moving average convergence divergence) crossings on Gold's daily bars have been good for at least 20 additional price points in the same direction, (i.e. $2,000/contract). That very measure is poised to make a negative cross come Monday, such that (were the Rhythm to continue) a move lower from the current level of 1316 down 20 points would bring us to 1296, still comfortably above that 1281-1271 trading support area noted earlier. The good news is that should Gold then continue to be on good behavior, its next reward would be back up and appealingly on a run toward taking out the Short parabolic red dots to flip the broader-trend back to Long.
We'll leave you for this week with these three quick hits:
1) When the lady on the top-of-the-radio news leads with: "You are wealthier today as your 401k went up with the Dow crossing 15,700" my cautionary antennae stretch out to the max. And with Q3 Earnings Season in full swing, (41% of 1,385 top-tier companies thus far not improving their year-over-year quarterly profits), I suggest you first ingest some meclizine should you decide to peek at the current p/e of the S&P; (I'll keep it a surprise, but 'tis at the website).
2) Is our StateSide Treasury suffering a case of "pecuniary envy"? This bit midweek from the FinTimes: "US Treasury attacks Germany over surplus ... report says Germany’s nominal current account surplus bigger than China’s." Too bad. Besides, spending dough that you only owe is a Gold Positive.
3) Lastly, despite what might be going around the depository rumour mill, 'twas not me that left the 280 small (4oz.) bars of Gold found a week ago in the Boeing 737 lavatory of a Fly Dubai jet. But I appreciate the thought, (I think...)
- English (UK)
- English (India)
- English (Canada)
- English (Australia)
- English (South Africa)
- English (Philippines)
- English (Nigeria)
- Deutsch
- Español (España)
- Español (México)
- Français
- Italiano
- Nederlands
- Português (Portugal)
- Polski
- Português (Brasil)
- Русский
- Türkçe
- العربية
- Ελληνικά
- Svenska
- Suomi
- עברית
- 日本語
- 한국어
- 简体中文
- 繁體中文
- Bahasa Indonesia
- Bahasa Melayu
- ไทย
- Tiếng Việt
- हिंदी
Gold On Good Behavior, Will It Continue?
Published 11/04/2013, 01:20 AM
Updated 07/09/2023, 06:31 AM
Gold On Good Behavior, Will It Continue?
3rd party Ad. Not an offer or recommendation by Investing.com. See disclosure here or
remove ads
.
Latest comments
Oh Mark you continue to be wrong wrong wrong on your bullish predictions for gold. If someone would have done the opposite of what you said in your past bullish predictions and have gone short they would have made a pretty penny. Please please stop being wrong by realizing gold is in a bear market and will continue in a bear market. Although at some point your bullish predictions will come true but not until gold is under $1000. God save your soul if you continue to be bullish in this bear market!!
Install Our App
Risk Disclosure: Trading in financial instruments and/or cryptocurrencies involves high risks including the risk of losing some, or all, of your investment amount, and may not be suitable for all investors. Prices of cryptocurrencies are extremely volatile and may be affected by external factors such as financial, regulatory or political events. Trading on margin increases the financial risks.
Before deciding to trade in financial instrument or cryptocurrencies you should be fully informed of the risks and costs associated with trading the financial markets, carefully consider your investment objectives, level of experience, and risk appetite, and seek professional advice where needed.
Fusion Media would like to remind you that the data contained in this website is not necessarily real-time nor accurate. The data and prices on the website are not necessarily provided by any market or exchange, but may be provided by market makers, and so prices may not be accurate and may differ from the actual price at any given market, meaning prices are indicative and not appropriate for trading purposes. Fusion Media and any provider of the data contained in this website will not accept liability for any loss or damage as a result of your trading, or your reliance on the information contained within this website.
It is prohibited to use, store, reproduce, display, modify, transmit or distribute the data contained in this website without the explicit prior written permission of Fusion Media and/or the data provider. All intellectual property rights are reserved by the providers and/or the exchange providing the data contained in this website.
Fusion Media may be compensated by the advertisers that appear on the website, based on your interaction with the advertisements or advertisers.
© 2007-2024 - Fusion Media Limited. All Rights Reserved.