In our “The Financial Waves Monthly Update” report of July 2013, we had predicted that gold will continue to underperform, and it is acting as a worst investment tool for the investors. In the update, we had mentioned that gold looks to have definitely ended the secular bull trend of the past 10 years, and should underperform other asset classes for 21 more years! We can witness that our predictions are proving to be fruitful, and the prices are trading at the lows of the last 5 years.
Why do we think gold will start multi-decade underperformance?
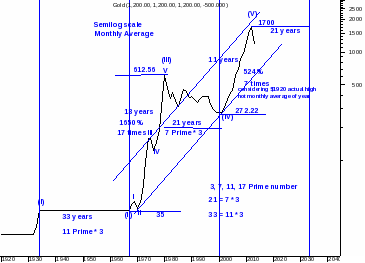
The below chart is explanatory…
Gold: No longer a safe haven
Gold spot USD yearly (monthly average) chart of July 2013

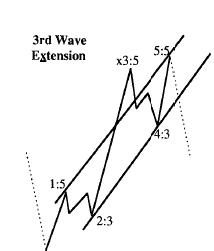
Ideal chart:

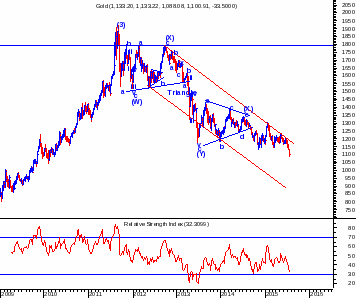
Comex Gold weekly chart as of 22 July 2015


The following was published in July 2013 when gold was trading near $1400 and is currently trading below $1100 - Gold has been one of the favorite investment vehicles for over a decade. The reason being obvious for the euphoria, as seen from Figure 10, which also shows gold path from 1920 till date. Prices have increased multifold from $272.22 in 2002 to near 1700 levels (monthly average for the year) or $1920 actual high in just a decade. This is astonishing 7 times, or 524% returns, in 11 years. People tend to flock to the asset class that has been in a secular bull trend. This is a good strategy, but the problem is that when this secular trend ends, the next leg of the bear market is not acceptable to many investors, since they have not seen gold underperforming during their investment career, or probably refuse to accept the fact that it can underperform other asset classes.
Gold love for prime numbers: We can see multiple relationships in terms of price and time. Gold moved in a controlled fashion prior to 1968, and so we can see prices constant at $35 for 33 years. Even in a controlled fashion, the time for Cycle degree wave (II) is 33 years, which is 11*3, both of which are prime numbers. The rally in cycle degree (III) took prices towards $612.56, i.e. an increase of 17 times in 13 years, both of which are again prime numbers. Cycle wave (IV) lasted for 21 years, which is 7*3, both again prime numbers. Cycle wave (IV) started from 272.22 and made a monthly average high of 1700 in 2012 or actual high of 1920 in 2011. Considering actual high prices increased by 7 times in 11 years (both again prime).
Time cycles: Gold is following 33 years bottoming Time cycles very precisely since 1930. This gives next bottom low in 2030 exactly at the period when DJIA cycle is topping out. This means money will flow back to gold from equity markets after 2030.
From wave perspective, even if gold moved in a controlled fashion prior to 1968, we are seeing very clear 5 waves on upside. We have shown idealized chart along with actual chart in figure 10. If our assumption of cycle degree (V) is right, then gold should move at least towards previous wave top at $612 levels at minimum.
In short, gold looks to have definitely ended secular bull trend of past 10 years, and should underperform other asset classes for more 21 years!
Happened: As per weekly chart, Comex gold has continued its downward trend, which was started in 2012, and as of now, from the highs of 1345, prices are trading lower in the form of intermediate wave Z of complex correction. Internal structure of the same is explained in our Global research report. Prices have now taken out the pivot low of 1130 along with momentum.
