
It didn’t take long for the mining stocks to turn south once again. No wonder, given that their breakdown was more than verified.
Additionally, they also got bearish support from gold, the stock market, and the USD Index , which also confirmed their decisive move. For more details, let’s take a closer look at the chart below.
We've witnessed the USD's breakout and breakdowns in the precious metals market, followed by smaller corrections. That’s both: normal and natural.
If the USD Index tendency was really descending, and it was upward in case of PMs:
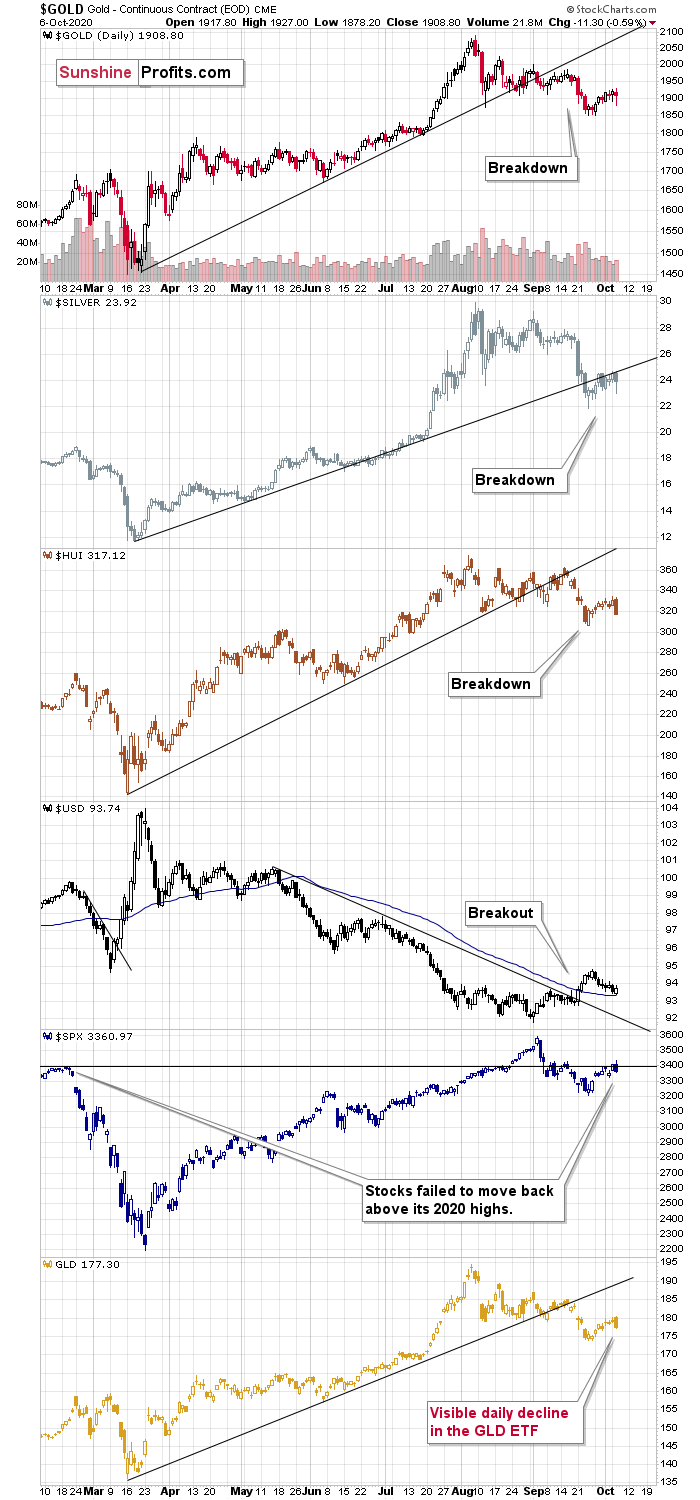
- The USD Index would have declined to new lows, or at least it would’ve moved below its 50-day moving average.
- Gold would have rallied back above the $2,000 level, or at least it would’ve moved visibly above its August lows in terms of the closing prices.
- Silver would have invalidated its breakdown below the rising support line, instead of verifying it as resistance.
- Gold miners (represented by the HUI Index in the middle of the above chart) would have shown strength relative to gold. For instance, they would not have declined yesterday more than gold or GLD ETF (NYSE:GLD) did.
Today, it’s evident that nothing from the above happened. And why is that? Because the medium-term trend changed in August and what we see now is just the early part of the decline. It seems that the noticeable pause after this decline is close to being over. But why? We’ll get to that shortly. In the meantime, let’s take a look at the general stock market performance.
The S&P 500 Index chart is second from the bottom and based on yesterday’s profound reversal. Stocks failed to rally back above the early-2020 highs. This is important evidence in determining the precious metals sector’s performance, particularly in the case of mining stocks and silver.

The correlational values in the rows that show the links between various parts of the precious metals market and the S&P 500 Index indicate that these links are indeed positive. However, it is only in the mining stocks that this link remains strongly positive in every examined period (ranging from 10 to 1,500 trading days). As far as medium-term moves are concerned, the S&P 500 and silver connection is stronger than the one between S&P 500 and gold.
Stocks failed to rally back above the early-2020 high and, therefore, in my view, they are quite likely to move lower, which would be in tune with the worsening pandemic situation.
Thus, the implication for the next several weeks remains quite bearish. Let’s get back to the previous question: Why do we think that the current pause within the decline is over.
In short, it’s because that’s what the triangle-vertex-based-reversal technique is currently suggesting, and it was able to pinpoint the last three short-term reversals very well. In short, whenever support and resistance lines cross, there’s likely to be some type of reversal. But does it work? Of course, not all the time, but in general – you can bet it does. Please take a look at the chart below for details.

The short-term triangle-vertex-based reversals were quite useful in timing the final moments of the given short-term moves in the past few weeks. Please keep in mind that the early and late September lows developed when the support and resistance lines were crossed.
Now, this technique might not work on a precise basis, but rather on a near-to basis, and given the highly political character of the current month (before the U.S. presidential elections), things might move in a somewhat chaotic manner. In previous months and years, this technique worked multiple times, and it has worked recently as well.
Based on yesterday’s decline, it seems that the early-October reversal point did mark the end of the rally. To be precise, gold did move slightly higher after that time, but the vast majority of the upswing was over at that time, and it was the “pennies to the upside, dollars to the downside” kind of situation.
Since this technique was so useful recently, and since we already saw a sizable downswing yesterday, it seems that the corrective rally is already over.

The GDX (NYSE:GDX) ETF – the flagship ETF for the precious metals mining stocks – closed at the second-lowest levels since July. That’s now how a medium-term rally looks like. That’s how a post-breakdown decline looks like.
Instead of rallying, miners simply corrected to the previously broken rising red support line, and they verified it as resistance. Since miners have already taken a breather, they appear ready to fall further.