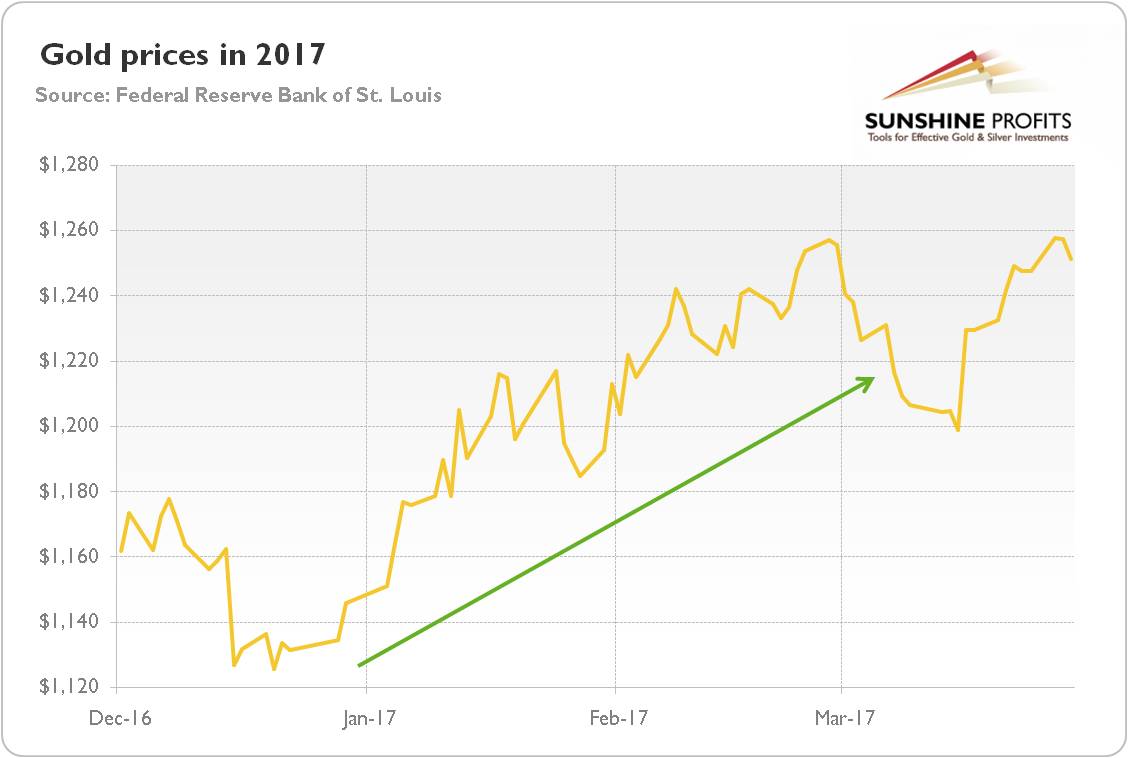
Gold performed really well in the first quarter of 2017. As the chart below shows, the rally started at the end of December 2016. The yellow metal bottomed at $1,125.7 on December 20, just a few days after the FOMC meeting and the second interest rate hike for almost a decade. Since then, the shiny metal gained about 11 percent.
Chart 1: The price of gold in U.S. dollars in 2017 (London P.M. Fix).

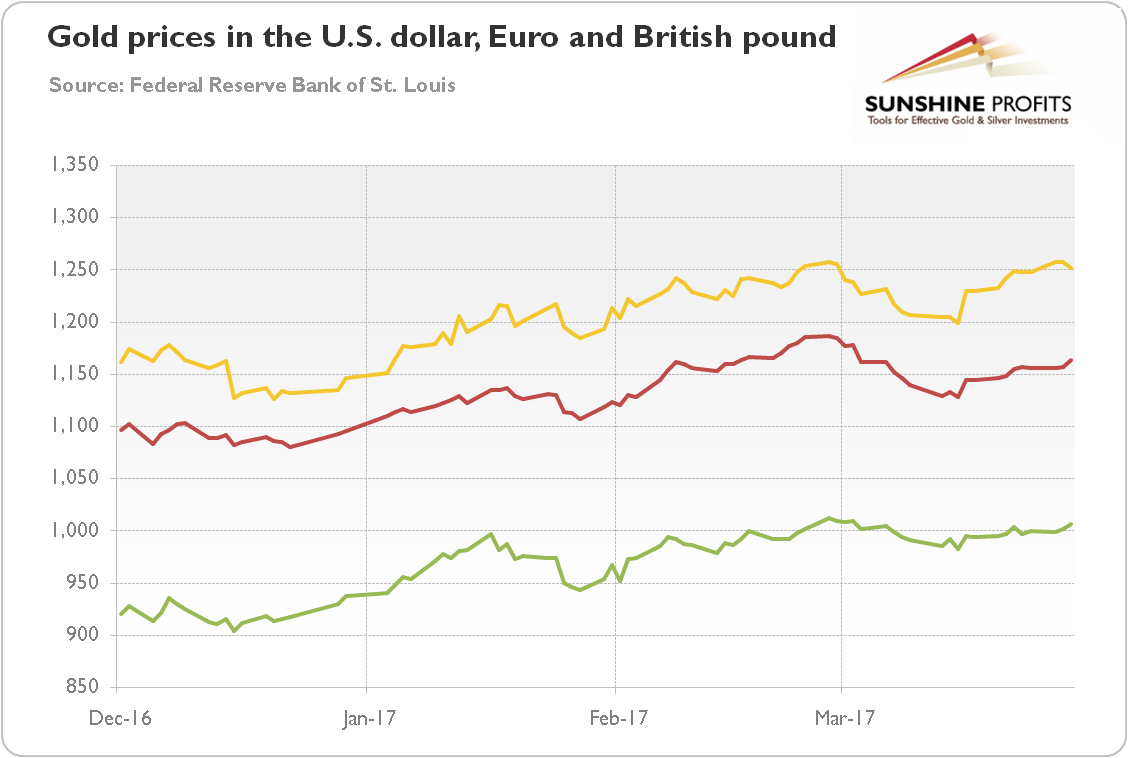
As one can see below, the price of gold expressed in euros and British pounds developed in a similar way to the U.S. dollar-denominated price. However, on a relative basis, the price of gold gained more in the greenback than in these two currencies (the bullion gained about 7 percent in euros and almost 11 percent in the British pound since the December lows), which seems to reflect an appreciation of the common currency against the U.S. dollar.
Chart 2: The price of gold in the U.S. dollar (yellow line), the euro (red line) and the British pound (green line) in 2017 (London P.M. Fix).

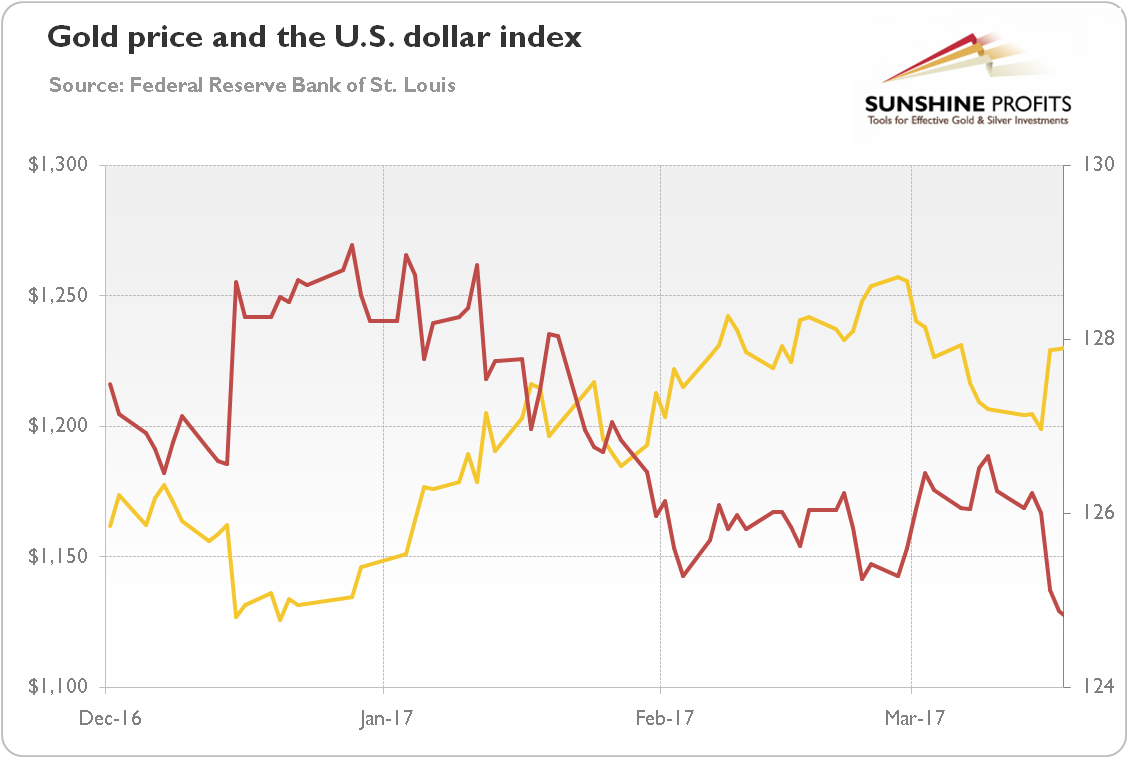
Indeed, the greenback was one of the main drivers of the gold prices in the third quarter of 2017. As usual, there was a strong negative correlation between these two safe-haven assets, as the chart below shows.
Chart 3: The price of gold (yellow line, left axis, P.M. London Fix) and the U.S. dollar index (red line, right axis, Trade Weighted Broad U.S. Dollar Index) in 2017.

After the December Fed hike the U.S. dollar surged while the price of gold bottomed out. However, as investors called the Fed hawkishness into question, the greenback declined, while the yellow metal shined. Other important drivers of the gold rally and dollar weakness were uncertainty about Trump’s policies and comments from Treasury Secretary Steve Mnuchin that the American currency is too strong. In March, gold went south, while the greenback jumped, anticipating the next hike at the FOMC meeting. Indeed, we saw a classic “sell the rumor, buy the fact” scenario in the gold market (with a “buy the rumor, sell the fact” scenario in the U.S. dollar), as the expectations surrounding a rate hike were actually much worse than the actual hike.
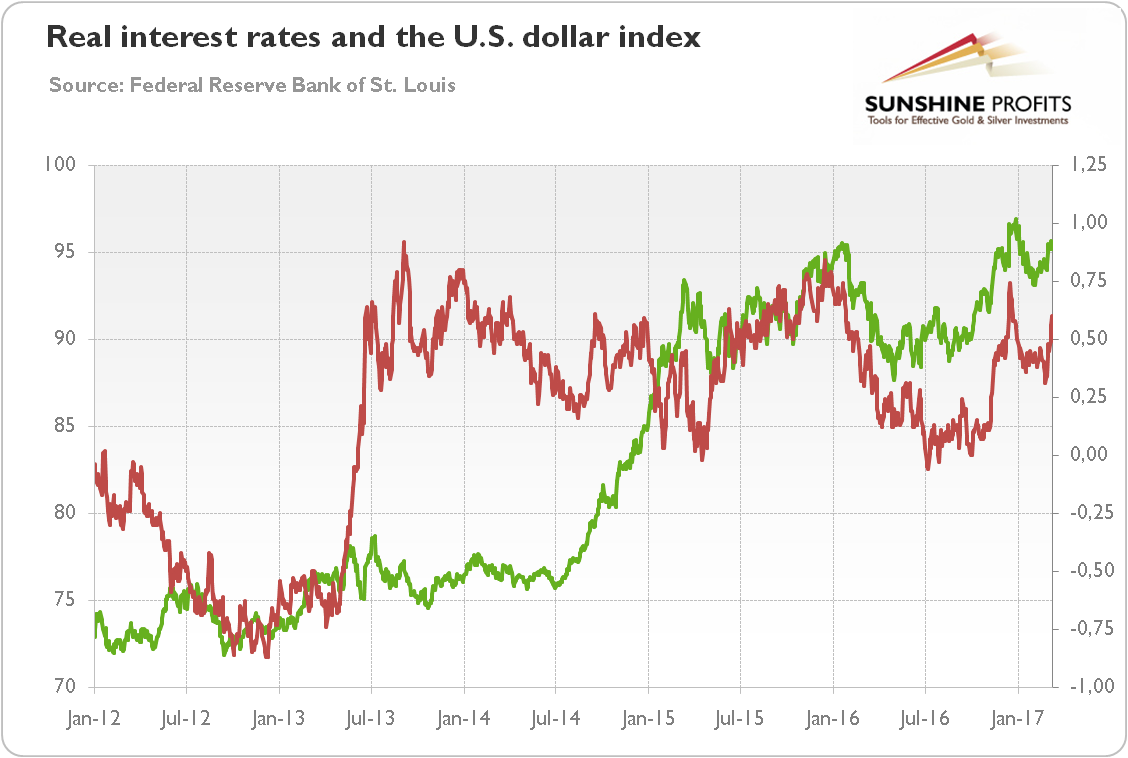
Now, the key question is what’s next for the yellow metal. Given the strong relationship with the greenback, the issue boils down to the outlook for the U.S. currency. Well, we believe that the medium-term trend in the greenback is higher, despite the pullback in the first quarter of 2017. As one can see in the chart below, the U.S. dollar has been in an upward trend since 2014. We have also seen an uptick in the real interest rates since the mid-2016.
Chart 4: The U.S. real interest rates (red line, right axis, yields on 10-year Treasury Inflation-Indexed Security) and the U.S. dollar index (green line, left axis, Trade Weighted Major U.S. Dollar Index) over the last five years.

The dollar simply has stronger fundamentals than its major rivals. The U.S. economy should still develop faster than Europe’s (or Japan’s). And the Fed is likely to continue its much more hawkish policy than the ECB (or the BoJ). Consequently, the yield differential between the dollar and the euro should continue to widen, supporting the U.S. dollar. Hence, the greenback continues to be the prettiest of the ugly sisters, offering higher and growing yield.
It’s true that the euro gained after the Mario Draghi’s hawkish comments in March. However, the euro should remain in its long-term downward trend, at least until the ECB ends the quantitative easing and starts hiking interest rates. It would be a long road towards normalization of rates – as a reminder, the Fed started its hikes after the asset purchases were first tapered and finally completed. And the elections in France and Germany are big headwinds for the common currency, as investors are likely to sell the euro, preparing for the worst. Of course, there will be ups and downs, but the Euro area (and its currency) is simply more fragile and less resilient to negative shocks than the U.S.
To sum up, in 2017 the price of gold has risen about 9 percent. Although there was a pullback in the greenback and the real interest rates in the first quarter of the year, we believe that the dollar bull market will remain intact, at least until investors shift their focus from the U.S. towards the monetary policy in the Eurozone and Japan. By that time, the Fed interest rate hikes should only strengthen the greenback. The appreciation of the U.S. dollar is traditionally bearish for gold. On the other hand, the failure of introducing Trump’s pro-growth and the resulting end of the reflation trend could send the greenback down for a while, supporting the gold price.
