I was looking for some excellent earnings numbers this past week and in the week to come but they’ve been lacklustre.
My thinking was last week and the week to come would be great, and perhaps compel stocks higher for a week or two after and then we’d be in for a nice period of consolidation until about November when we’d see strength return out of bases and we’d be in for a nice winter.
The market has other plans and we are seeing mixed results and choppy stock action which tells me we may be ready for a couple or few months of consolidation starting pretty much now.
Time will tell, but the action has moved to sloppy so I’m toning down my complacency!
The metals continue to act great and are moving higher, leading me into that sector on a small basis, but I may be into miners more as the days progress.
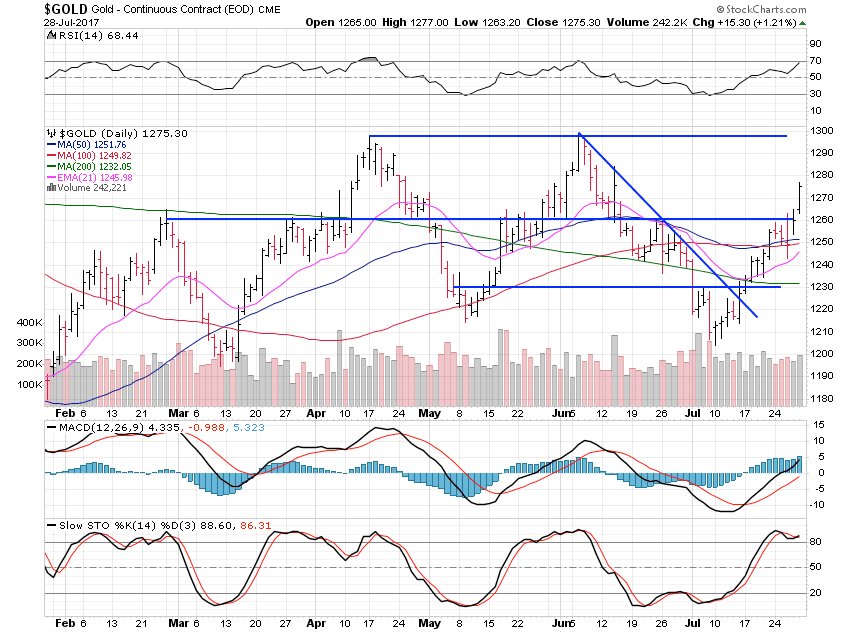
Gold gained 1.63% this past week as it moved above the moving average cluster at $1,250.

We’re now free to move to $1,300 where resistance is likely.
Also, with tensions rising in North Korea there is no telling if we get an extraordinary move from gold but if recent years are any tell, that chance is slim.
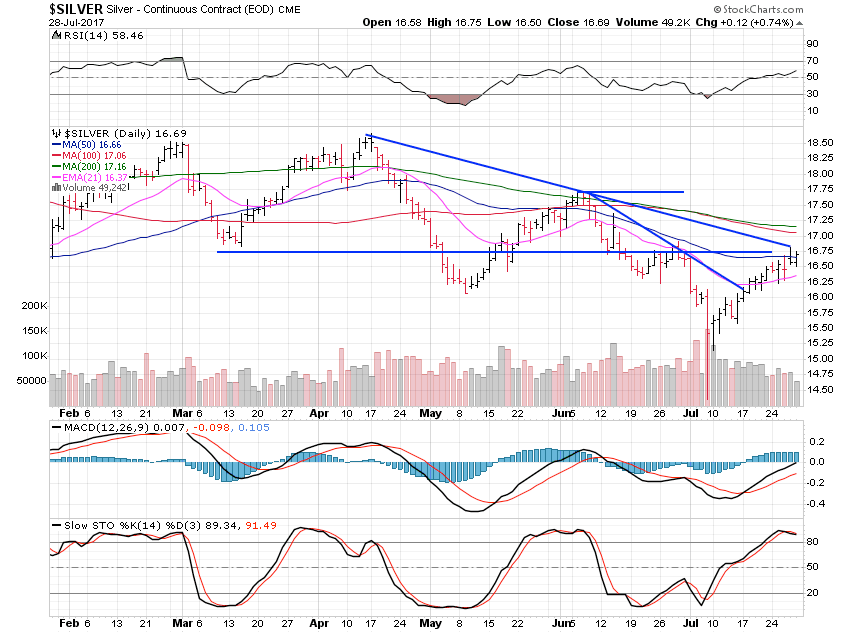
Silver rose 1.45% this past week and has some heavy resistance at $16.75 to move past still.

There are some heavy moving averages around $17.15 but $17.75 is the level on this chart I’d look for resistance as we likely move to $18.50 on this move.
I’ve been wrong many times before so we can only wait and see, and trade accordingly.
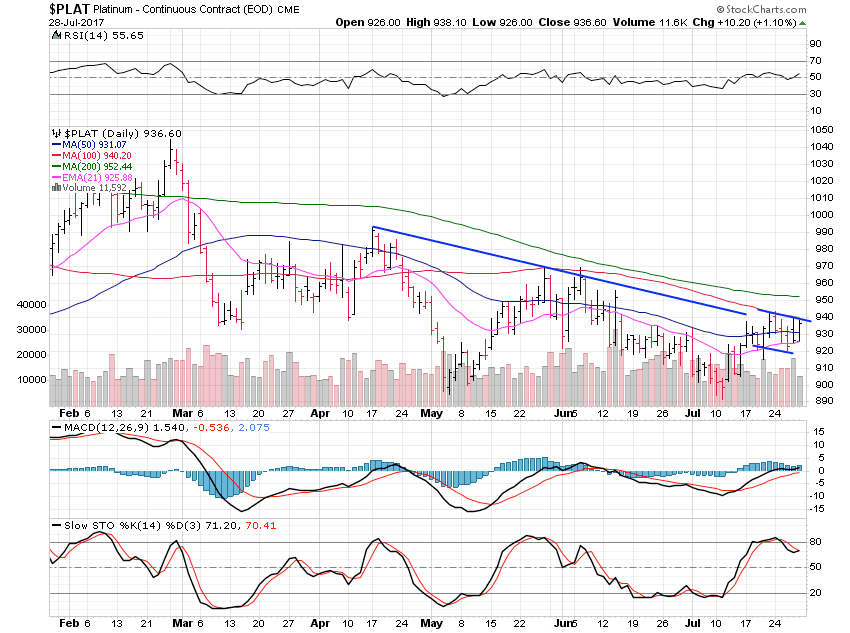
Platinum was flat, losing just 0.09% but is looking set for a run.

A break above the $940 area would be the buy level and $970 where we will likely see resistance appear as we move towards $990.
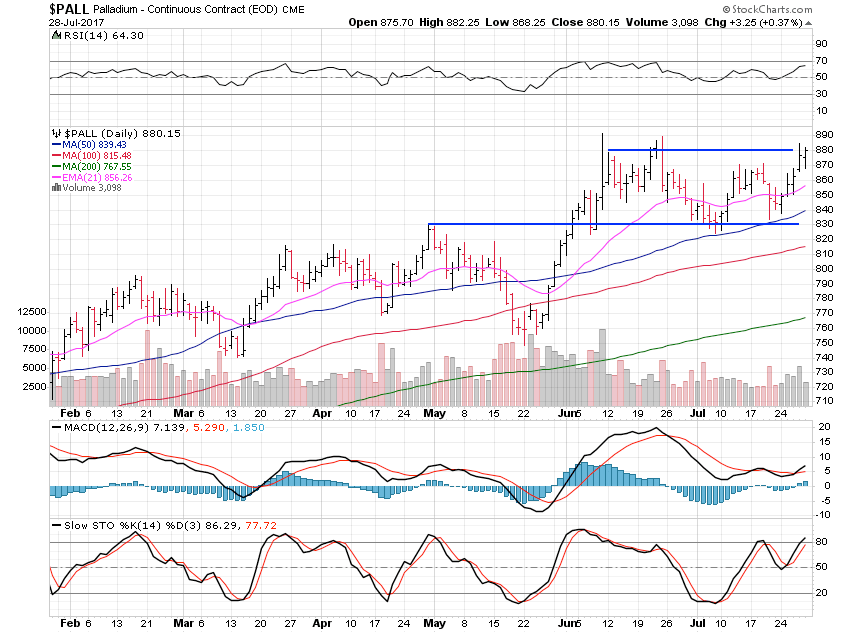
Palladium gained a hefty 4.24% but remains rangebound for now.

The sweet range from $830 to $880 is being tested right now and is likely to be broken to the upside.
Highs are $913 back in 2014 and only time will tell if we breakout into new highs or not.
It looks great on this daily chart but the monthly chart is still pretty parabolic which means more rest could be due before new highs are seen, but....
If gold and silver continue to strengthen, we should see palladium move into blue sky territory.
Enjoy your weekend and I’m beginning to be more cautious with my trades now and thinking about locking in some gains and taking a couple months mostly off while trades setup again for us.