Gold prices rallied on open today following the political fiasco in US over the weekend. However, prices were not able to hold onto the gains, suggesting that the overall bearish pressure is huge even though short-term trend is bullish based on the recovery from last week’s 1,305 low.
Hourly Chart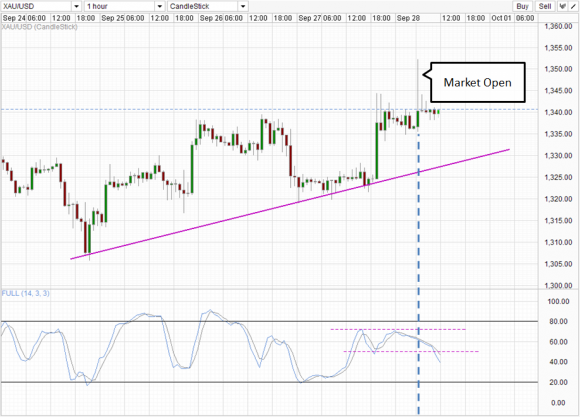 XAU/USD 1" border="0">
From a technical perspective, the failure to break 1,340 is bearish and opens up the ascending trendline as a possible bearish target. Stochastic agrees, with readings breaking the “support” level which was where the previous Stoch trough seen on last Friday. It is possible that prices will tag the rising trendline at around 1,330 if we descend moderately, which happens to be the confluence with the ceiling between 24-25th Sep and the floor of 26th Sep. Furthermore, 1,330 – 1,345 has been regarded as the resistance band seen on the weekly chart, and as such we can reasonably expect prices to find strong support from there. This is also echoed by Stochastic readings which will most likely be Oversold or close to the previous 2 major trough levels (see 24th and 27th Sep troughs), potentially generating a bullish cycle signal when prices hit the 1,330 mark. Nonetheless, because strong support is expected, should prices manage to break the 1,330/rising trendline confluence, the implication would be extremely bearish, and we could see strong bearish momentum pushing lower quickly.
Weekly Chart XAU/USD 2" border="0" height="416" width="580">
This potential strong bearish momentum is also hinted at from the Weekly Chart. Previous 2 weeks price action suggest that the initial bearish rejection from 1,400/Channel Bottom on the last week of August has stalled, with Stochastic readings flattening out. However, should prices manage to push below 1,330 and 1,300, the likelihood of bearish momentum reverting will be high and we could see potential acceleration towards Channel Top which is currently below 1,200. This may open up even lower bearish targets especially since 1,200 was the level where July – Sep recovery began.
Fundamentally, it is strange to see latest CFTC Commitment of Traders numbers net long positions have actually grew, breaking the streak of 3 consecutive weeks of decline. However, it should be noted that the numbers were taken from Tuesday, exactly where last week’s bullish recovery began. Therefore, this is by no means a confirmation that market is still bullish with 1,340 continue to hold firm. Instead, traders may wish to focus on this week’s numbers for a better gauge of speculative action. Should Net Long positions fall, coupled with prices breaking 1,330 by the end of this Tuesday, this may be a good indication that institutional speculators are favoring a longer term bear. Conversely, should prices actually break 1,340 (preferably above this morning’s swing high) with a higher Net Long positions, we will be in a better position for stronger bullish correction that may lead us to Channel Bottom of weekly chart which is around 1,360 – 1,370 next week.
Original post
- English (UK)
- English (India)
- English (Canada)
- English (Australia)
- English (South Africa)
- English (Philippines)
- English (Nigeria)
- Deutsch
- Español (España)
- Español (México)
- Français
- Italiano
- Nederlands
- Português (Portugal)
- Polski
- Português (Brasil)
- Русский
- Türkçe
- العربية
- Ελληνικά
- Svenska
- Suomi
- עברית
- 日本語
- 한국어
- 简体中文
- 繁體中文
- Bahasa Indonesia
- Bahasa Melayu
- ไทย
- Tiếng Việt
- हिंदी
Gold Higher On U.S. Debt Issue But 1,340 Resistance Holding
Published 09/30/2013, 02:25 AM
Updated 07/09/2023, 06:31 AM
Gold Higher On U.S. Debt Issue But 1,340 Resistance Holding
3rd party Ad. Not an offer or recommendation by Investing.com. See disclosure here or
remove ads
.
Latest comments
Install Our App
Risk Disclosure: Trading in financial instruments and/or cryptocurrencies involves high risks including the risk of losing some, or all, of your investment amount, and may not be suitable for all investors. Prices of cryptocurrencies are extremely volatile and may be affected by external factors such as financial, regulatory or political events. Trading on margin increases the financial risks.
Before deciding to trade in financial instrument or cryptocurrencies you should be fully informed of the risks and costs associated with trading the financial markets, carefully consider your investment objectives, level of experience, and risk appetite, and seek professional advice where needed.
Fusion Media would like to remind you that the data contained in this website is not necessarily real-time nor accurate. The data and prices on the website are not necessarily provided by any market or exchange, but may be provided by market makers, and so prices may not be accurate and may differ from the actual price at any given market, meaning prices are indicative and not appropriate for trading purposes. Fusion Media and any provider of the data contained in this website will not accept liability for any loss or damage as a result of your trading, or your reliance on the information contained within this website.
It is prohibited to use, store, reproduce, display, modify, transmit or distribute the data contained in this website without the explicit prior written permission of Fusion Media and/or the data provider. All intellectual property rights are reserved by the providers and/or the exchange providing the data contained in this website.
Fusion Media may be compensated by the advertisers that appear on the website, based on your interaction with the advertisements or advertisers.
© 2007-2024 - Fusion Media Limited. All Rights Reserved.