That over which we warranted concern some three missives ago is playing out for gold per this quote from our post-Thanksgiving piece:
...when gold's been sub-1199 during 2016, there's really not been any material [support] following January's price stallage in the lower 1100s to upper 1000s, from which price ascended during February as quick as a wit, well up into the 1200s. So to give back February's run would be beyond bad...
"Bad"--(MJ, '87) has since happened, and big time so this past week, as gold's robust gains from last February were gutted, whilst silver was swiftly punted. In settling out the week yesterday (Friday) at 1136.8, gold traded within a hair's breadth (1128.5) of February's low (1115.3), all those glorious gains since that time having been hellaciously hoovered away. gold's -2.1% weekly undoing brought to mind the following film dialogue used to described the death of a secret agent as having been "garotted in a geisha house", --(Casino Royale, '67). And as for Sister Silver's even worse loss for the week of -4.6%, she basically had her ever-lovin' derrière punted clear outta the stadium, to crash onto the parking lot yesterday in settling the week 16.140.
With but two weeks left in 2016, gold year-to-date has been up as much as +29.9% (at 1377.5 on 06 July), presently being up but +7.2%, the like measures for silver being +53.5% (at 21.225 on 05 July) but now only +16.7%. That's a plethora of percents having been pulverized ... and yet both precious metals -- if they can survive 2016's final two weeks -- will put in their first winning year since 2012 ... the irony is staggering as gold and silver falter toward falling across the finish line.
'Course, the rally 'round the S&P 500, (which on Tuesday hit an all-time high of 2277.53), has post-Fed Hike made three "lower high" days in-a-row. Nonetheless, the S&P's's having settled out the week at 2258.07 with an accompanying "live" price/earnings ratio of 33.9x brought us to make this gold-positive point in a correspondence last evening:
Stock (and attendant markets) shall struggle mightily in the Trump Era given earnings must double just to meet current pricing, especially should rates and inflation ratchet up. That is a gold positive as we saw in 2004-2006. Yet, should the sudden, (some might say 'convenient' in having assumed an HC victory), economic boom go 'boom' (i.e. 'bust'), that too shall be a gold positive especially given the balance of the industrialized world remaining in stimulus mode. ‘Tis thus a 'win-win' for gold.
To be sure, all of our usual pro-gold bluster sounds nice, but as we turn to gold's weekly bars, we face the truth of price, the gold Long's head in a vise:
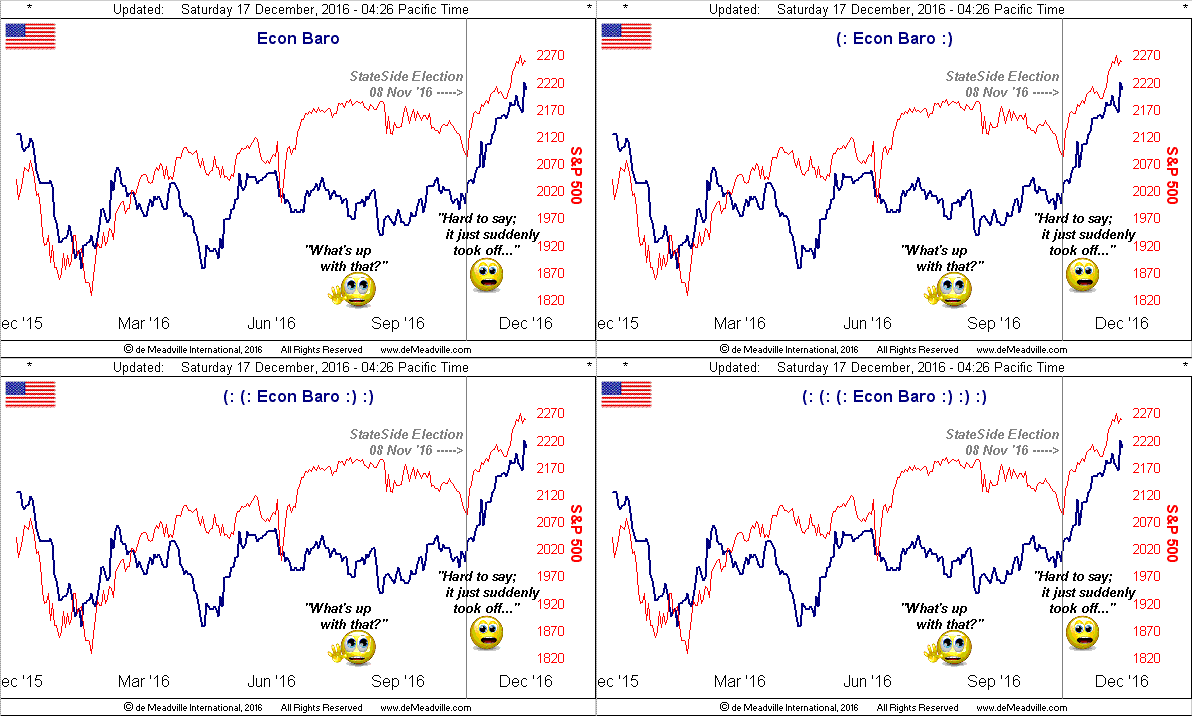
Speaking of "truth" how 'bout that Economic Barometer, its gains of late being nothing short of scintillating! And as an apolitical rather than conspiratorial observance, one has to admit that the timing of the Econ Baro's taking off was remarkable. The incoming data coming from the October and November reporting periods has been terrific with notable leaps in Consumer Confidence, Durable Orders, Existing Home Sales, Factory Orders and Personal Income.
That justifies a raise for me, right mmb?
Just keep your hat on, Squire, as there's been overflow into December as well, with monthly leaps for the NAHB Housing Index from 63 to 70, for the NY Empire State Index from 1.5 to 9.0, and for the ole Philly Fed Index from 7.6 to 21.5. Phenomenal! And all just like that, albeit the bulk of the Baro's bounce is reflected post-StateSide election. But it does raise the question as to if the data was getting "pumped" so to speak, ('twould make for a marvy movie). Either way, the monthly reporting of "revisions" might get quite interesting going forward:
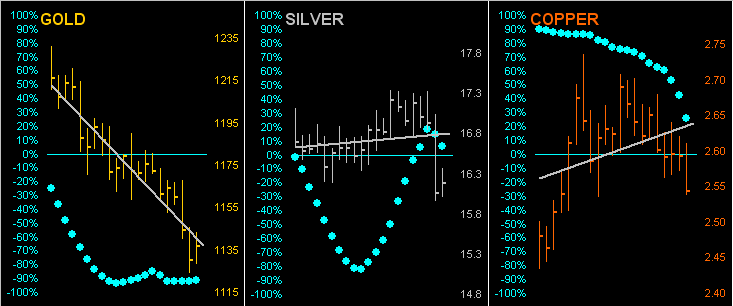
Specific to the three metals themselves that we dutifully track within the overall complex of the BEGOS Markets (Bond, Euro/Swiss, gold/Silver/Copper, Oil, S&P), here are their respective daily bars over the past 21 trading days (one month) along with their "Baby Blues" which depict the consistency of each market's 21-day linear regression trend (the grey diagonal line in each panel).
The news here is a bit daunting for silver: clearly gold's trend is the worst of the three, Sister Silver's industrial metal jacket keeping her more aligned with Cousin Copper. But woe be unto the red metal as the blue dots acceleratively drop off, which -- should gold not get a grip here -- ought bode poorly for silver, who in turn really needs gold to come riding through here to the upside, sweep Sister Silver off of her feet and adorn her in precious metal pinstripes toward taking her back to higher ground:
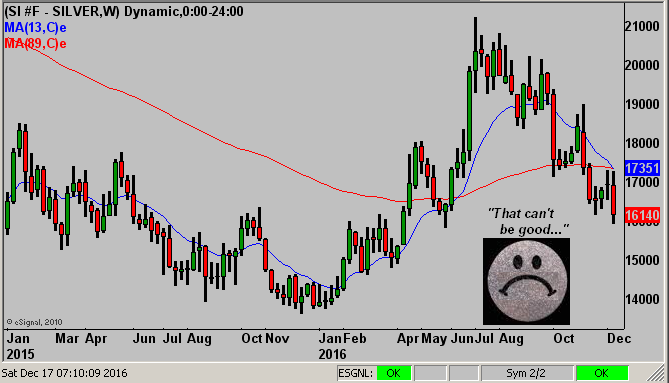
Scary as well for silver is this imminent negative crossing of her "exponential moving averages" (13/89) as displayed across her weekly bars going back to January of 2015.
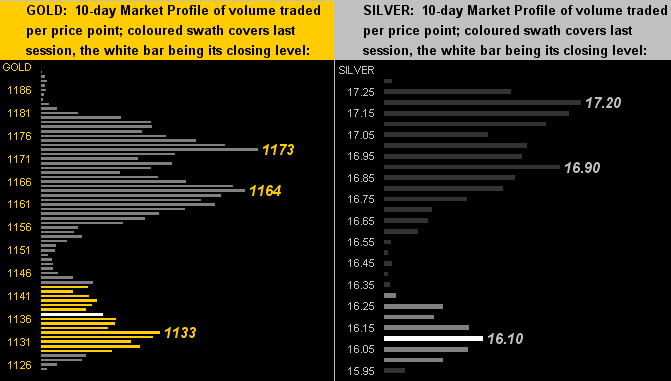
Again, 'tis important for gold to step up here, saving Sister Silver from further demise. So to see what that means by near-term measuring, let's go to the 10-day Market Profiles. And the level of protective support shows stark in both cases: on the left for gold, it need hold 1133; on the right for silver, she's standing on the precipice at 16.10:
All-in-all, not a pretty picture for the precious metals, the Bow-Wow Buck having become the world's de facto asset of choice, not just as a currency in leading the so-called Ugly Dog Contest, but seemingly of all things bubblicious as well, such as the stock market. Here's the Doggie Dollar from 30+ years ago-to-date, the wee mongrel now really getting its gander up, with claws deeply ensconced in gold's skin:
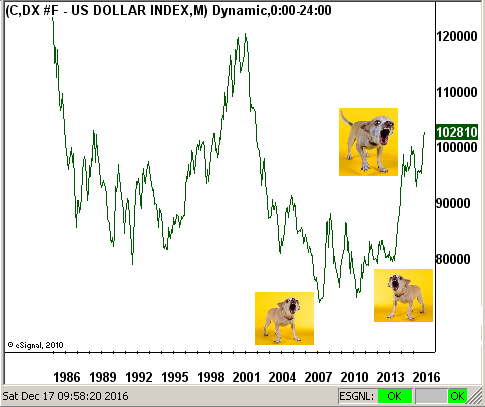
How much more to the fore can the dollar soar? From the aspect of supply (as measured by "M2") it has gone from $1.59 trillion in 1980 to $13.27 trillion today, an increase of +734%; moreover, M2 remained sub-$2 trillion into 1983. Not only has supply of gold over the same 30+ years only barely doubled, but its average price into 1983 was $442/oz. Let's thus do the math to get on par with the Dollar: $442/oz. x 734% = $3,244/oz.
Or per the opening scoreboard at the top of these missives, even incorporating gold's own supply increase, we've calc'd the value today at $2,659/oz. And that does not include the supply growth of other fiat Bow-Wow currencies, nor debt, nor derivatives. And yet gold sits today at the ever-so lowly level of a wee $1,137/oz. (hint hint ... Nudge Nudge ... ELBOW ELBOW!)