
Greetings from the high country here in Squaw Valley where yesterday (Friday) with much pomp and ado was celebrated the opening of the 2018/2019 ski season: expect that there isn't any snow. Nonetheless we've been outdoors on the tennis courts and hiking above the 8,500ft. (2,600m) level.
Rather akin to the ever-present pomp and ado bestowed upon Gold by we steadfast analysts: except that there isn't any price movement of substance. Nonetheless, let's start with this stimulative not-so-breaking news:
"Flash! What just happened with the price of Gold?" ... well, nothing of material note of course, save for this otherwise unnoticed tidbit as depicted above in the opening Gold Scoreboard. Ready?
For the first time since mid-July Gold just settled out a week above at least one of the last two years' like weeks, now at 1222 being higher than when price was at 1207 to this point in 2016, (but obviously still below where 'twas at 1294 this time a year ago). And yet...
With the Bond market, EuroCurrencies, Oil and the S&P 500 all lurching about in fits and starts due to skepticism over Chairman Powell lauding the Federal Reserve Bank's Open Market Committee because the economy "is in such a good place right now" (exemplary of their not following the Economic Barometer) ... to Dominic Raab's sudden resignation as the UK Brexit Secretary ... to the wheels coming off of petroleum prices although now there's Saudi SupplyCutSpeak ... to regulatory bank tightening come January as Representative Waters takes the Chair of the House Financial Services Committee ... throughout it all Old Gold is just sittin' there aloofly gazing into space:
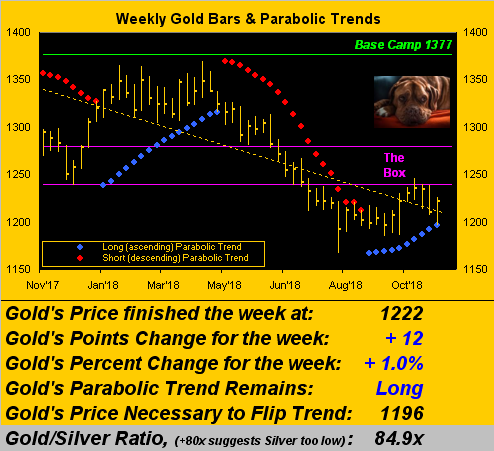
To be sure, Gold's change this past week of +12 points (+1%) clearly is, as we oft quip, welcome; but remindfully, change is an illusion whereas price is the truth. And per the weekly bars shown below, today at 1222 even with Gold having survived the week without the parabolic trend flipping to Short, (which in the new week would occur should 1196 trade), such lowly levels of price we continue to endure! Moreover, 'tis trapped between the base of The Box (1240-1280) and the squeezing blue dots of parabolic Long trend. As put forth a week ago, the 1180s are lingering below.
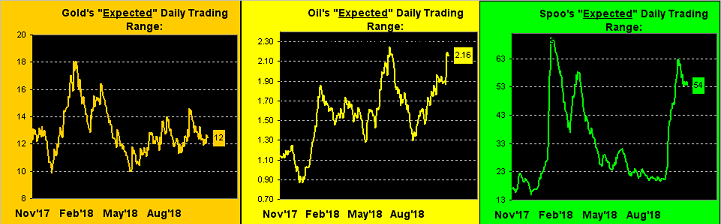
Either way, Gold's "expected daily trading range" (EDTR) remains docile compared to those of the other BEGOS Markets (Bond, Euro/Swiss, Gold/Silver/Copper, Oil, S&P). For example across the three-panel graphic below we've the EDTRs from one year ago-to-date for Gold at left, Oil at center and the S&P at right. Pacelessly driftin' along is our Gold:
As for the aforementioned Economic Barometer, we're starting to see some slowing of its multi-month skid. This past week brought marked improvement for October's Retail Sales plus a pop in the Consumer Price Index, albeit Industrial Production slowed. And depending upon your locale of measure, November's New York State Empire Index spritely leapt from 21.1 to 23.3, but the Philadelphia Fed Index fell hard from 22.2 to 12.9. Here's the year-over-year Baro along with the head-over-heels S&P 500 (red line):
Diverting back to Gold we've price's daily bars below on the left from three months ago-to-date along with the baby blue dots of linear regression trend consistency: divergence indeed as price of late has been in ascent whilst the "Baby Blues" further their own descent, the latter looking to will out should price stall per the thicket of structural resistance to its left. Meanwhile in the 10-day Market Profile below on the right, specific trading resistors are depicted at 1225 and 1233, with supporters showing at 1212 and 1203:

Very similar is the picture for Sister Silver with price below left rising in the face of her falling blue dots. In the Profile below right the resistors sit at 14.55 and 14.65 with the supporters at 14.15 and 14.00. And still, as noted in the earlier graphic of Gold's weekly bars, the Gold/Silver ratio remains well above the rarefied air level of 80x at 84.9x (!)

Toward closing, and with a moderate week of incoming Econ Data mostly all squished into next Wednesday for the Econ Baro given the StateSide Thanksgiving holiday, did anyone note, or even care, that mighty bitcoin lost 15% of its value last week in trading below the vaunted 6000 level for the first time in three months? Perhaps Christine Lagarde did. As Managing Director and Chairwoman of the International Monetary Fund she proffered the notion of a state-backed digital currency, for which we've these two questions:
■ Why?
■ Why not just accumulate more Gold?