
Movement below 1,340.90 invalidated yesterday’s hourly wave count. I have gone back and re-analysed this recent upwards movement from 1,251.76 because something else must be happening.
The wave count at the daily chart level remains mostly the same. I have two hourly wave counts for you today which both expect the same movement next.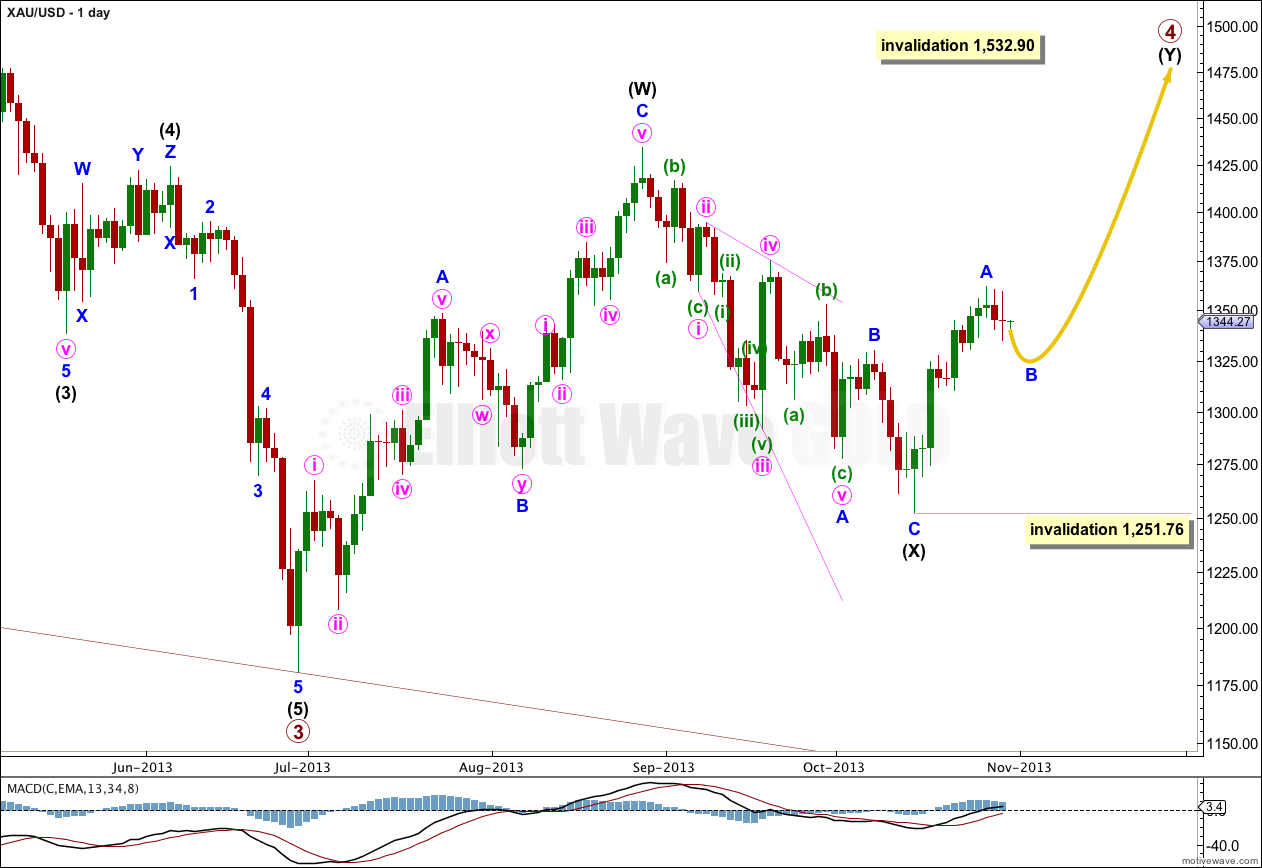
The structure for primary wave 4 cannot be a flat correction, because what would be the B wave is well less than 90% of what would be the A wave. That is why I have labeled it as a double.
Because intermediate wave (X) is quite shallow I would expect primary wave 4 is most likely a double zigzag rather than a double combination. Double combinations move price sideways and their X waves are usually deeper than this one is. Double zigzags trend against the main direction, and their purpose is to deepen a correction when the first zigzag did not take price deep enough. So I will be expecting intermediate wave (Y) to subdivide as a zigzag and to take price comfortably above 1,433.83. It should last about 35 to 45 days or sessions in total.
Within the zigzag of intermediate wave (Y) minor wave B may move beyond the start of minor wave A. This wave count is invalidated with movement below 1,251.76.
Main Hourly Wave Count.
Minor wave A can be counted as a complete five wave impulse.
Ratios within minor wave A are: minute wave iii is 3.86 short of 1.618 the length of minute wave i, and minute wave v is 3.43 short of equality with minute wave iii.
Within minor wave A minute wave ii is a flat and minute wave iv is a double combination, providing nice alternation.
This wave count agrees with MACD. The strongest upwards momentum is within the third wave, and the second and fourth waves correspond to MACD coming very close to, or touching, the zero line.
The channel drawn here is Elliott’s first technique. This channel is clearly breached by downwards movement. Minor wave A should be over and minor wave B should be close to completion now. I would expect minor wave B to end within the next few hours.
At 1,325 minute wave c within minor wave B would reach 1.618 the length of minute wave a. This would bring minor wave B to just above the 0.382 Fibonacci ratio of minor wave A.
Minor wave B may not move beyond the start of minor wave A. This wave count is invalidated with movement below 1,251.76.
Alternate Hourly Wave Count.
Alternatively, this downwards movement may be a fourth wave correction instead of a B wave.
This wave count does not agree with MACD though, which is why it is my alternate. I want to consider all possibilities, even those with a low probability. For this alternate the strongest upwards momentum is within the first wave of the third wave.
For this alternate minor wave A is incomplete. Minute wave iii is 2.90 short of 2.618 the length of minute wave i.
The target remains the same. At 1,325 minuette wave (c) within the zigzag of minute wave iv would reach 1.618 the length of minuette wave (a). This would bring minute wave iv down to the 0.382 Fibonacci ratio of minute wave iii.
Minute wave iv may not move into minute wave i price territory. This wave count is invalidated with movement below 1,288.18.
- English (UK)
- English (India)
- English (Canada)
- English (Australia)
- English (South Africa)
- English (Philippines)
- English (Nigeria)
- Deutsch
- Español (España)
- Español (México)
- Français
- Italiano
- Nederlands
- Português (Portugal)
- Polski
- Português (Brasil)
- Русский
- Türkçe
- العربية
- Ελληνικά
- Svenska
- Suomi
- עברית
- 日本語
- 한국어
- 简体中文
- 繁體中文
- Bahasa Indonesia
- Bahasa Melayu
- ไทย
- Tiếng Việt
- हिंदी
Gold Elliott Wave Technical Analysis
Published 10/30/2013, 08:19 PM
Updated 07/09/2023, 06:32 AM
Gold Elliott Wave Technical Analysis
Latest comments
Loading next article…
Install Our App
Risk Disclosure: Trading in financial instruments and/or cryptocurrencies involves high risks including the risk of losing some, or all, of your investment amount, and may not be suitable for all investors. Prices of cryptocurrencies are extremely volatile and may be affected by external factors such as financial, regulatory or political events. Trading on margin increases the financial risks.
Before deciding to trade in financial instrument or cryptocurrencies you should be fully informed of the risks and costs associated with trading the financial markets, carefully consider your investment objectives, level of experience, and risk appetite, and seek professional advice where needed.
Fusion Media would like to remind you that the data contained in this website is not necessarily real-time nor accurate. The data and prices on the website are not necessarily provided by any market or exchange, but may be provided by market makers, and so prices may not be accurate and may differ from the actual price at any given market, meaning prices are indicative and not appropriate for trading purposes. Fusion Media and any provider of the data contained in this website will not accept liability for any loss or damage as a result of your trading, or your reliance on the information contained within this website.
It is prohibited to use, store, reproduce, display, modify, transmit or distribute the data contained in this website without the explicit prior written permission of Fusion Media and/or the data provider. All intellectual property rights are reserved by the providers and/or the exchange providing the data contained in this website.
Fusion Media may be compensated by the advertisers that appear on the website, based on your interaction with the advertisements or advertisers.
© 2007-2024 - Fusion Media Limited. All Rights Reserved.