Get 40% Off
🚨 Volatile Markets? Find Hidden Gems for Serious Outperformance
Find Stocks Now

Gold Dives To 1767 After Hawkish Fed

Published 06/18/2021, 06:56 AM
Updated 07/09/2023, 06:31 AM

XAU/USD tumbled on Wednesday, after the Fed signaled that interest rates in the US could start rising in 2023. The free fall continued yesterday as well, with the metal hitting support at 1767, a territory which offered strong support between Apr. 19 and May 3.

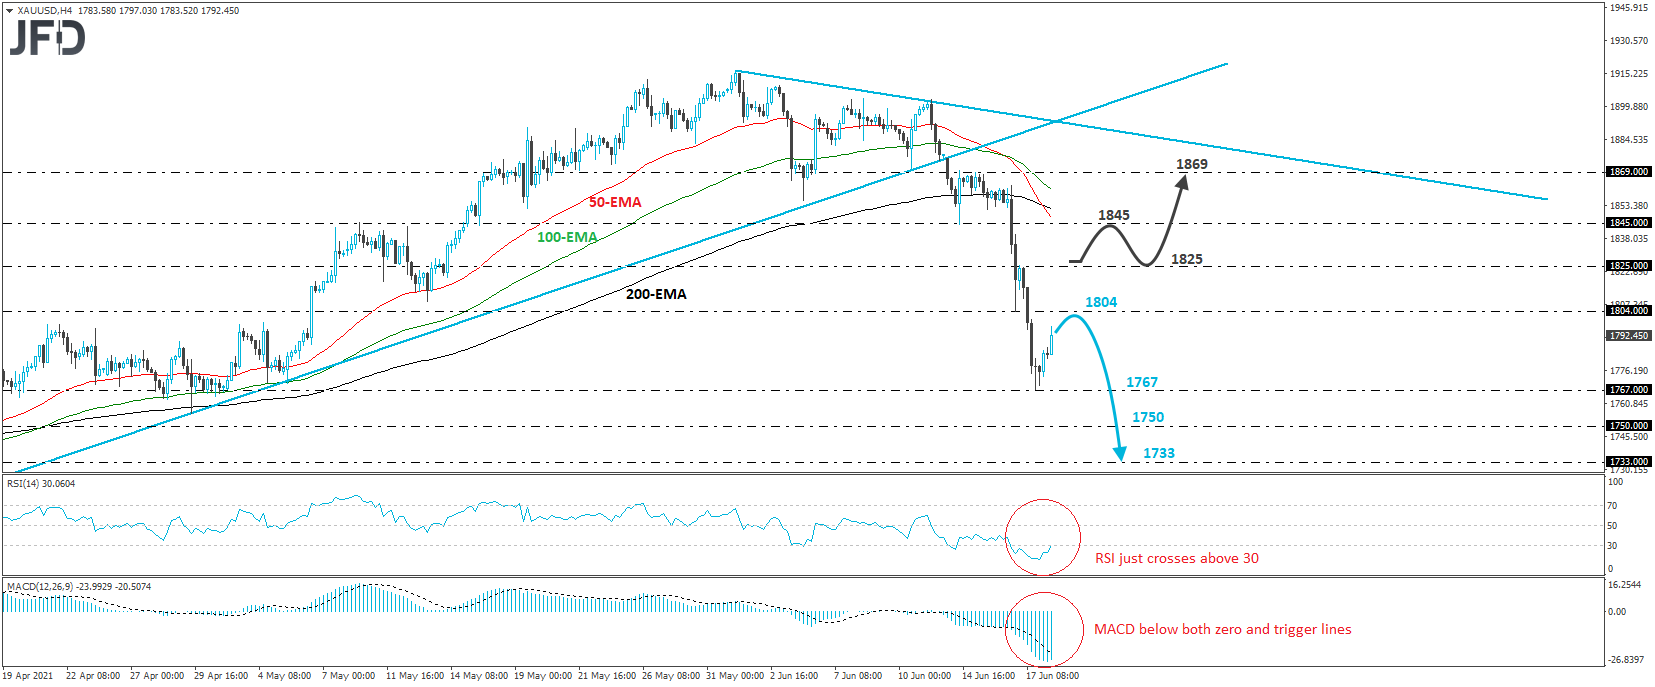
Thereafter, gold rebounded and today it looks to be headed towards Wednesday’s low of 1804. Overall, the metal is trading well below the prior upside support line drawn from the low of Mar. 31, and also well below a newly established downside line, taken from the high of June 1. Therefore, we would consider the near-term outlook to be bearish.

If the bears are strong enough to take charge again from near the 1804 area, we could see another leg south towards the 1767 support zone. That said, we would like to see a move below that key obstacle before we get confident on more declines. Such a move would confirm a forthcoming lower low and may initially target the inside swing high of Apr. 14 at 1750. Another dip, below 1750, could extend the slide towards the low of that day, at 1733.

Looking at our short-term oscillators, we see that the RSI rebounded and just poked its nose above its 30 line, while the MACD, although below both its zero and trigger lines, shows signs of turning up as well. Both indicators detect slowing downside speed and support the case for some further recovery before the next leg south, perhaps for a test near 1804.

3rd party Ad. Not an offer or recommendation by Investing.com. See disclosure here or remove ads .

Now, in order to start examining whether the upside correction will last longer, we would like to see a move above 1825, a resistance marked by yesterday’s high. The next hurdle may be the inside swing low of June 14, at 1825, the break of which could pave the way towards the peak of the day after, at around 1869.
Gold XAU/USD 4-hour chart technical analysis

Latest comments

Risk Disclosure: Trading in financial instruments and/or cryptocurrencies involves high risks including the risk of losing some, or all, of your investment amount, and may not be suitable for all investors. Prices of cryptocurrencies are extremely volatile and may be affected by external factors such as financial, regulatory or political events. Trading on margin increases the financial risks.
Before deciding to trade in financial instrument or cryptocurrencies you should be fully informed of the risks and costs associated with trading the financial markets, carefully consider your investment objectives, level of experience, and risk appetite, and seek professional advice where needed.
Fusion Media would like to remind you that the data contained in this website is not necessarily real-time nor accurate. The data and prices on the website are not necessarily provided by any market or exchange, but may be provided by market makers, and so prices may not be accurate and may differ from the actual price at any given market, meaning prices are indicative and not appropriate for trading purposes. Fusion Media and any provider of the data contained in this website will not accept liability for any loss or damage as a result of your trading, or your reliance on the information contained within this website.
It is prohibited to use, store, reproduce, display, modify, transmit or distribute the data contained in this website without the explicit prior written permission of Fusion Media and/or the data provider. All intellectual property rights are reserved by the providers and/or the exchange providing the data contained in this website.
Fusion Media may be compensated by the advertisers that appear on the website, based on your interaction with the advertisements or advertisers.
© 2007-2024 - Fusion Media Limited. All Rights Reserved.