Many are the analogies one might make to describe gold -8.9% run from the week's high of 1338, down through the whole 1280-1240 support zone, to the week's low of 1219, in turn momentarily penetrating the rising 300-day moving average at 1222.
We oft turn for these descriptives to motor sports, wherein across its vast broadcasting spectrum, we can select the characteristic eloquence of Formula One such as:
Apparently, Alistair, gold's overheating in the kinetic energy recovery system caused an igniting of the hydraulic lines running along the left-side cylinder bank so as to result in the engine's comprehensive expiration.
Or to instead select from the more down-to-earth vernacular of NASCAR, simply said: "Well, Mel, it looks like gold dun blowed up!" Either way, 'twasn't pretty, post-election.
Indeed gold has now swiftly gone quite a way down the road per this updated graphic with which we opened one week ago (when gold was 1305.2 and Silver 18.425) through yesterday's (Friday's) settles at 1227.4 and 17.365 respectively. Watch those "Baby Blues" in animation reflect the ruination of what had been brilliant upside consistency in the 21-day linear regression trends (grey diagonal lines) for both markets. Each panel of the animation is dated at the top and spans 21 trading days:
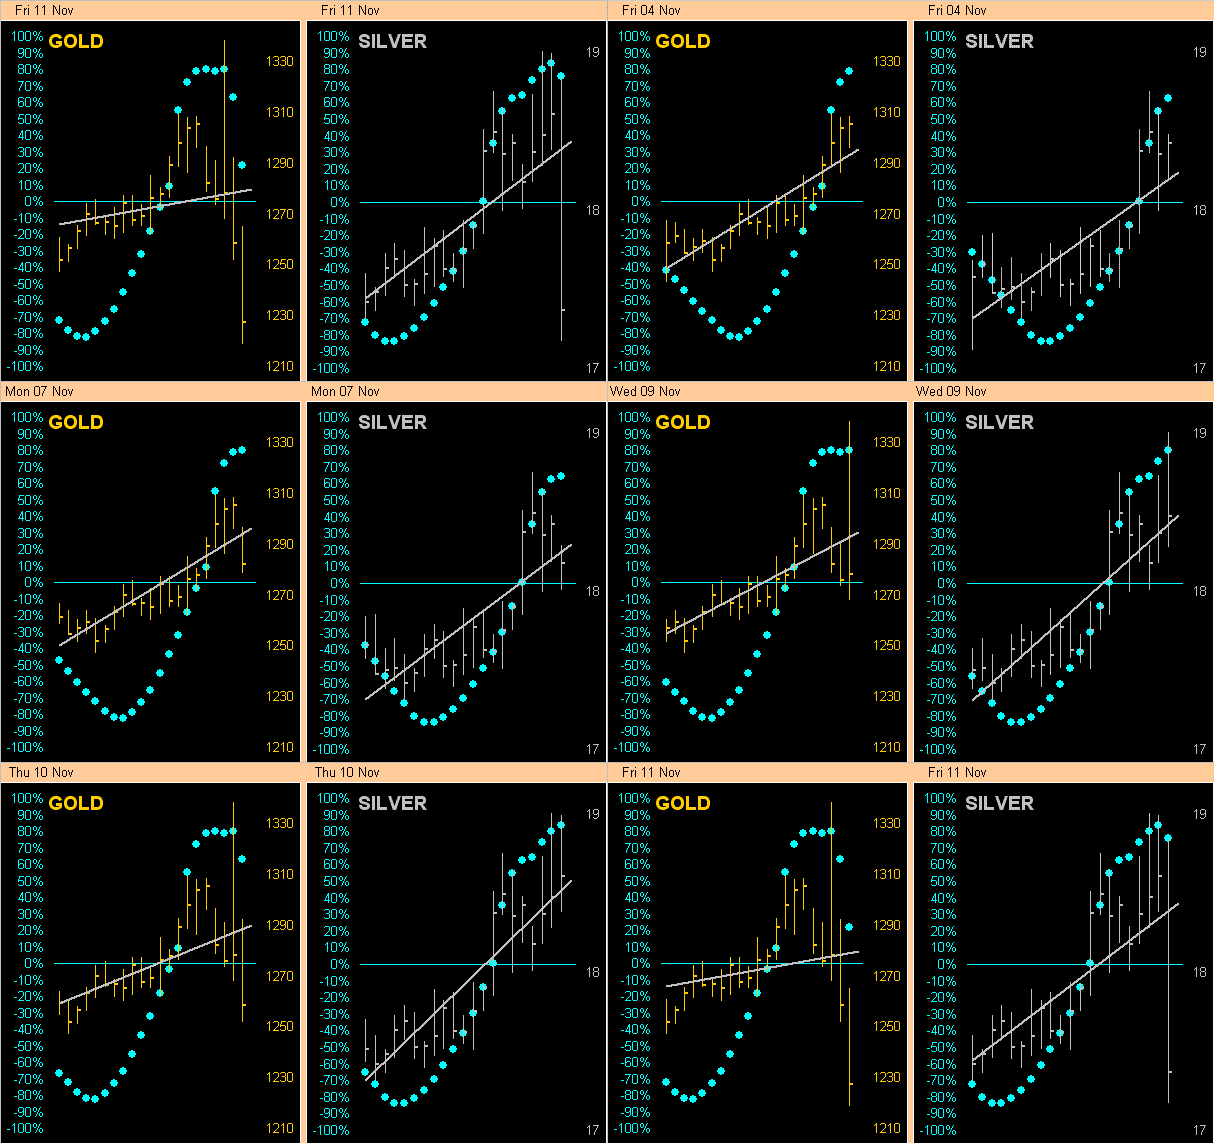
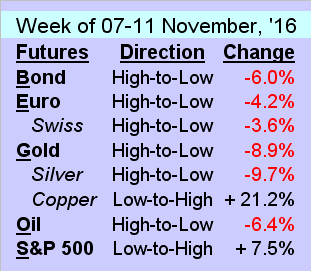
Silver's delayed reaction in succumbing with gold was due to the white metal's industrial (rather than precious) side being buoyed by copper's extraordinary intra-week price spike from low-to-high of +21.2%, before the red metal, too, finally bit the dust on Friday, in turn punting Sister Silver off the cliff down toward gold.
'Course, gold's pricing history has shown us it can rise just as fast, if not even faster, than it can fall; so should we find gold to be back atop 1300 in a week's time wouldn't surprise us at all. But specific to this week's nose-dive, if you wish to place at least technical blame on yours truly, we'll accept it, for having written pre-plunge as follows in Thursday's "Prescient Commentary"...
...At Market Trends, we're mindful that the "Baby Blues" for the PMs may breakdown from here to again test the near-term support in the Market Profiles for both gold... [then 1281.6, week's end 1227.4] ...and Silver... [then 18.730, week's end 17.365]
...by which we evidently spooked the crap outta the precious metals markets.
Don't give yourself too much credit there, mmb...
Swell of you to say, Squire, and obviously, 'twasn't just the precious metals that got rocked, as post-election fundamental reactions were violent across the BEGOS Markets as shown in the following table:
'Twas almost as if the President-elect had already been wildly successful in righting the StateSide economy to Reaganesque levels. But this just in from the "Pie in the Sky Dept.": the dude ain't even in office yet. And similar to Missouri's state motto, 20 January brings us only the inauguration of the next "Show Me" President, nothing more.
Nonetheless, much to the chagrin of half the nation, its next President is threatening to push for proven policies that create real economic growth. Fairly scary stuff for the freebies crowd out there to have to transit into full-time jobs with benefits ... say it ain't so! And you know what's oft a function of real economic growth?
Higher interest rates, mmb?
Given that rates are still essentially zero, Squire, yes ... at least up to reasonably acceptable levels. And higher rates ought effect the undoing of valuation extremes in bubblized assets from stocks to real estate. The "security" of having a "known return" can revive a desire for investing in debt and savings, allowing the S&P 500 either to burn off its 50% over-valuation, or wait for real earnings to catch up.
So mmb, are you gonna change your mind about the Fed not raising rates next month?
You've certainly kept us under your microscope there, Squire, in our being fairly adamant that not only shall the Federal Open Market Committee not raise rates, but indeed even rescind last year's hike. However now with the Bond getting absolutely smashed post-election, along with Copper's exploding to the upside, we may well change our tune and join the ranks who have assumed throughout the year that the Fed Funds rate will be nicked up in December, (similar to the way the status quo assumed a different US election outcome, that Brexit wouldn't pass, and that Carolina would win the Super Bowl).
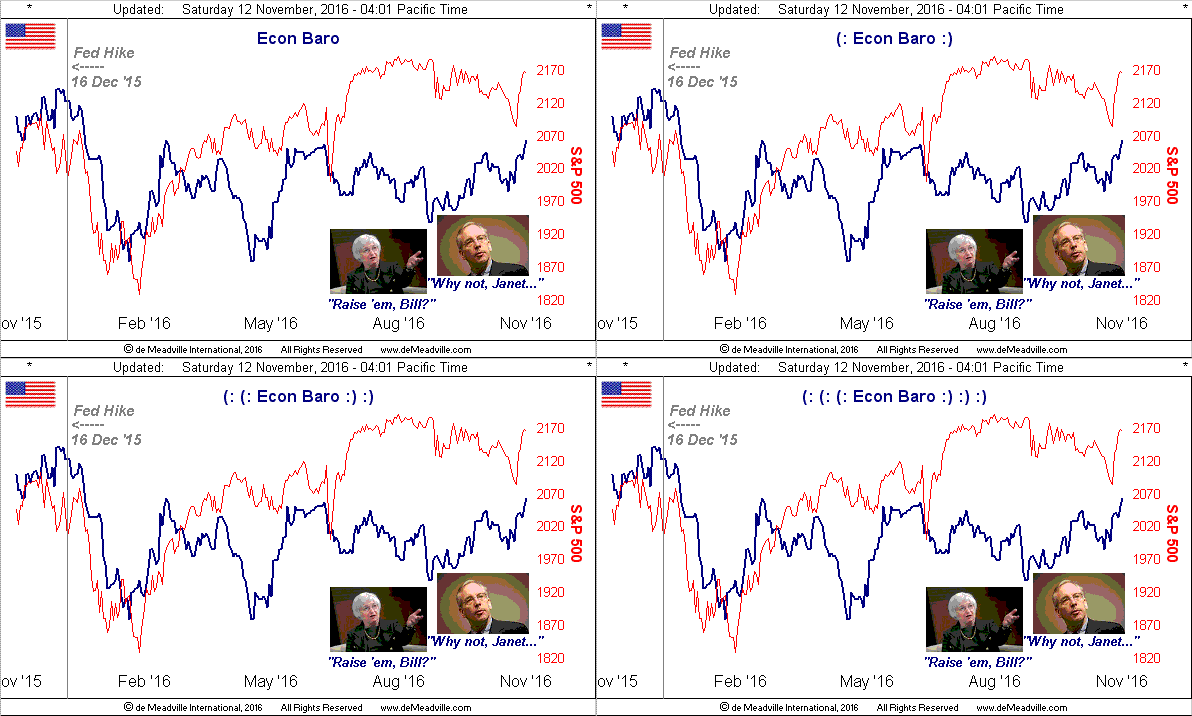
That said, the the bond market just told the FOMC to raise rates. But: 'tis a given that a lot shall transpire between now and the FOMC's next policy statement on 14 December, during which time our focus will be firmly upon the Economic Barometer, which whilst clearly now in an upswing, must prove itself to so stay over these next several weeks and the stock market not have a monumental meltdown. Should the Baro flop and the S&P severely plop, even with a blind eye to the political backdrop, notions of a rate hike could well stop. Either way, here's the Econ Baro and its recent pop:
Still, from the "Not So Fast Dept.", whilst the long end of the yield curve steepened week-over-week, (the 30yr. from 2.571% to 2.928% and the 10yr. from 1.783% to 2.117%), the Fed Funds futures closed the week unchanged at 0.50% (having dipped to as low as 0.45% as Tuesday's polls closed) in reflecting ongoing election fallout, which again likely lasts at least through the FOMC's December meeting.
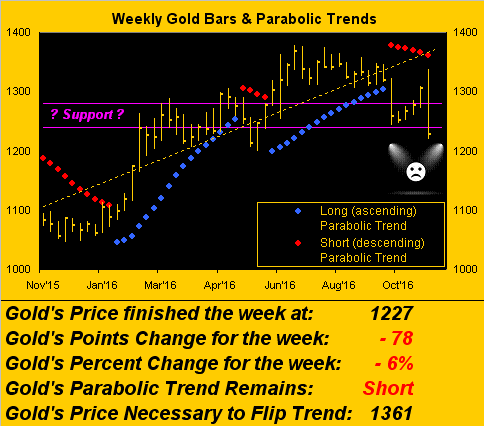
Specific to gold, price well and truly bust below the major 1280-1240 support zone in settling out the week at 1227. Technically, we ought label this as "technical damage"; however, given our expectations of the markets remaining nothing short of zany over the ensuing weeks, we hesitate to place that moniker on the yellow metal just yet, and thus what we sensed has happened here is the downside overshoot of support by the trading herd, rather than gold going deservedly over the falls. Here are the year-over-year weekly bars, (lookin' a l'il pale under those hot lights, eh fella?):
Three key things of which to remain mindful through here:
■ This President-elect is good for gold, given the potential shakeup over the next FedHead: Chair Yellen's term as Chair of the Fed's Board of Governors ends in January 2018, (she'll then remain on the Board until 2024); but Central Bank uncertainty is a de facto gold positive.
■ Raising rates equates at times to being good for gold, and you regular readers know this, in recalling the hikes in the Fed Funds rate during 2004-2006 from 1% to 5%, whilst gold simultaneously rose from 400 to 650 (+62%).
■ Is inflation 'round the bend? Does that further debase the currency? Is that good for gold?
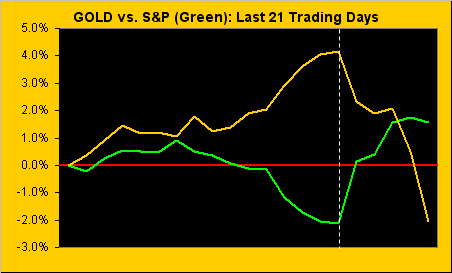
Again, this past week was not good for gold as we go to its comparative 21-day (one month) percentage change track vis-à-vis that for the S&P; the vertical dashed line is how these two markets compared a week ago, wherein we'd quipped them to be inversely in "quintessentially perfect symmetry" prior to gold's now having tripped in the dark over the threshold into the loo:
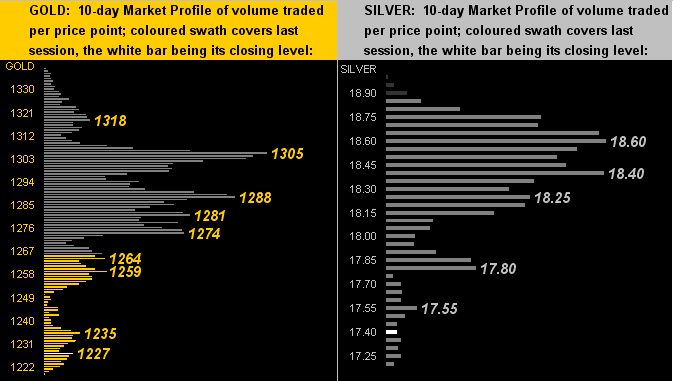
So as we go to this two-panel graphic of 10-day Market Profiles, there ought be no surprise to see gold on the left and silver on the right having fallen week-over-week through the entirety of their respective profile depths:
Toward closing, here's that which we promised a week ago in bookending the election with a "before and after" look at the Gold Stack. Thus for this week, 'tis the "after":
The Gold Stack
Gold's Value per Dollar Debasement, (from our opening "Scoreboard"): 2660
Gold’s All-Time High: 1923 (06 September 2011)
The Gateway to 2000: 1900+
Gold’s All-Time Closing High: 1900 (22 August 2011)
The Final Frontier: 1800-1900
The Northern Front: 1750-1800
On Maneuvers: 1579-1750
The Floor: 1466-1579
Le Sous-sol: Sub-1466
Base Camp: 1377
Year-to-Date High: also 1377 (06 July) or 1385 basis the December '16 contract
The Weekly Parabolic Price to flip Long: 1361
Gold Last Week: 1305, (expected daily trading range ["EDTR"]: then 14 points)
Neverland: The Whiny 1290s
10-Session “volume-weighted” average price magnet: 1286
Resistance Zone: up to 1280 (from 1240)
Trading Resistance: 1235 / 1259 / 1264 / 1274 / 1281 / 1288 / 1305 / 1318
Gold Currently: 1227, (expected daily trading range ["EDTR"]: now 25 points)
Trading Support: right here at 1227
The 300-Day Moving Average: 1222 and rising
10-Session directional range: down to 1219 (from 1338) = -119 points or -9%
Year-to-Date Low: 1061 (04 January)
As we head into the new week, 'twill not be just rife with ongoing election fallout, but full of incoming economic data as well, some 17 metrics scheduled to hit the Econ Baro. With so much heavy stuff on the table, we leave you for this week with the following light-hearted local election observance:
Consuming your favourite sweet soda pop 'round San Francisco is deemed so bad for your health that you'll now be taxed to so swill. But 'tis OK, as you can now also offset such taxation anguish by inhaling your sweet smoke of choice, lending moreover to a brighter future for whatever non-producing vineyards we have here in California. But in the interim, hey man, it might not be such a bad idea to groove on importing some of "That Acapulco Gold"--(The Rainy Daze, '67) before the tariffs go up in getting it into The Golden State. 'Course, the best state in which to be is one of Gold ownership, 'specially when it hits its own ultimate high, man!