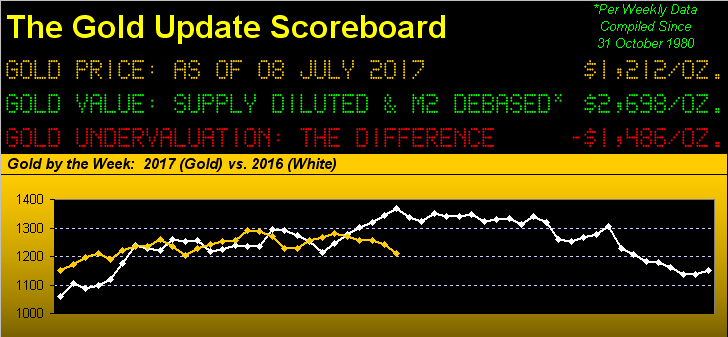
The good news is that gold finally has departed its seemingly inescapable 1240-1280 box. The bad news is that such departure was beleagueredly to the south, price settling out the week yesterday (Friday) at 1212. To be sure, per the above opening panel, gold's performance in 2017 has turned from robust promise into no-thrust malaise, the yellow metal being booted about as a commodity rather than as the world's longest-running, hard asset currency.
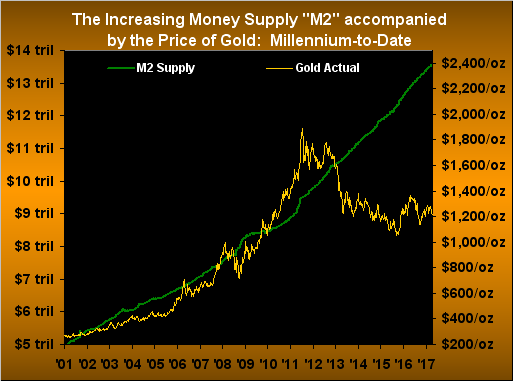
That said, 'tis paramount not to dismiss what we below view as gold's most important graphic. Here we have millennium-to-date the tracks of the StateSide money supply ("M2") and the price of gold. Note how they both rightly grew together, gold on occasion lagging M2, indeed even getting ahead of M2, but in any event, always returning to M2, such logical move now way overdue. And look to where that would put gold anew. Do not forget this very view:
"But mmb, with the Fed withdrawing liquidity, can't that green line instead come back down?"
In their dreams, Squire. 'Twould be like missing the shift gate in going from fourth to fifth, and oops, that was reverse. No sir, we don't see M2 turning downward, barring a reinvention of the Dollar into an Amero, or heaven forbid, a Worldo. In fact, come the completion this September of the U.S. federal fiscal year, both the White House and Congress agree that spending for the first time ever shall have exceeded $4 trillion. That's more than double what 'twas back in 1990 when George H.W. Bush was teaming up with Tip O'Neill in raising taxes, M2 back then being $3 trillion. Now 'tis $13 trillion. And yet gold today is but a paltry 1212?
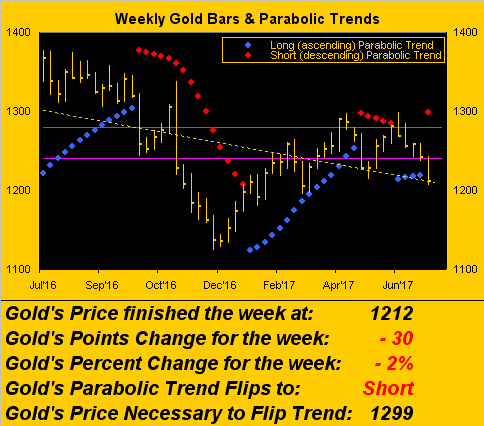
Hardly great as we next see per gold's weekly bars was the latest parabolic Long trend (blue dots), an abject four-week failing flop which has now flipped to Short (red dots). 'Course, because gold had been stuck in its 1240-1280 box for an eternity, the prior Short stint of its own accord saw price rise instead of fall. Annoyingly, the beautiful sweeping precision trends throughout much of the graphic have morphed into random paint-ball shots:
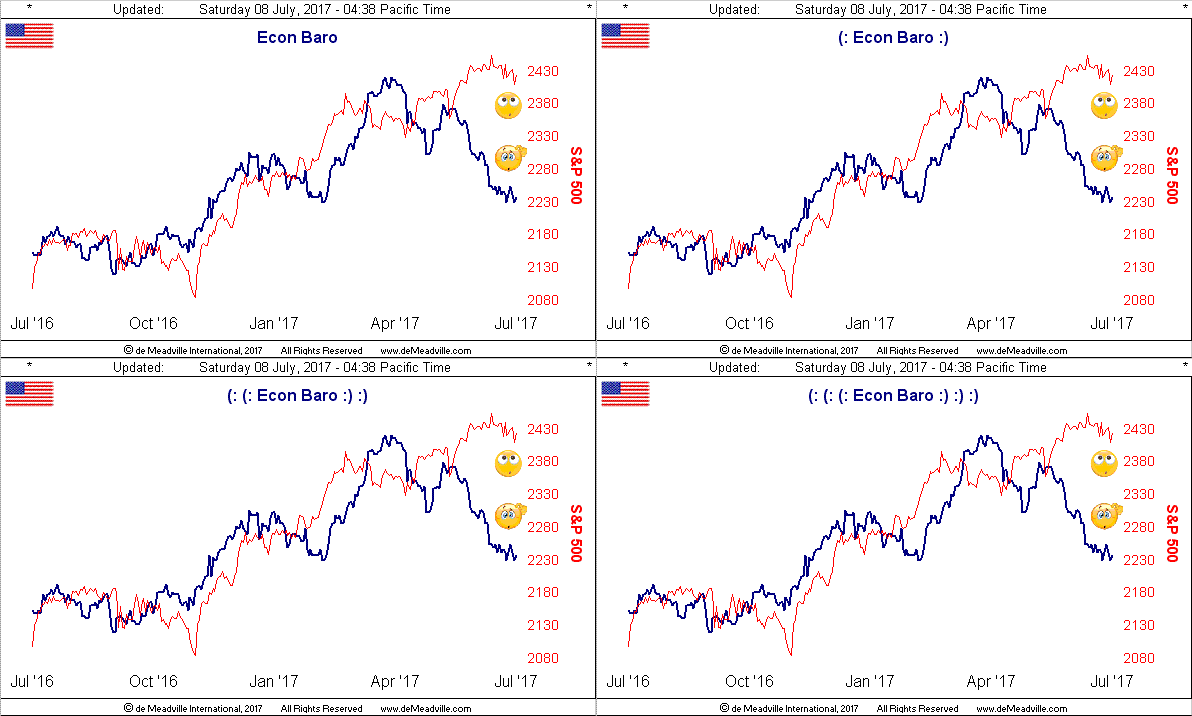
But not random a wit is the tell-tale sign of the weakening StateSide economy: it shows stark in the Economic Barometer, which 95% of the world doesn't see, (indeed the same 95% that don't own any gold). To be sure, the S&P 500 is ever so far afield from the present level of the Econ Baro: at what price might be the S&P the next time it encounters the blue line? Fortunately, your money manager is primed to front-run any overnight locking down of the S&P futures by getting your account flat just in the nick time, so no portfolio worries there, eh? Maybe even buy you some gold? Are we having fun yet?
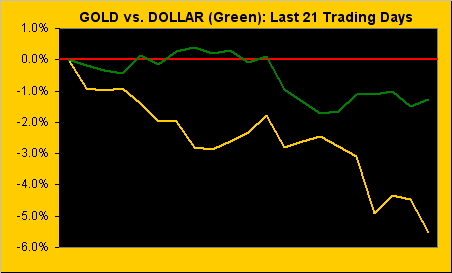
'Course, yesterday's cry was that the great payrolls increase (from 152k in May up to 222k in June) boosted the buck and thus gashed gold. Quickly forgotten were the first-reported ADP numbers (from 230k in May down to 158k in June), let alone the worsening decline in Factory Orders from -0.3% in April to -0.8% in May. But who's counting, as long as the stock market remains correction-less. What is correct is that both gold and dollar have been on the decline for at least the last 21 days as we see here, something "they" say cannot occur:
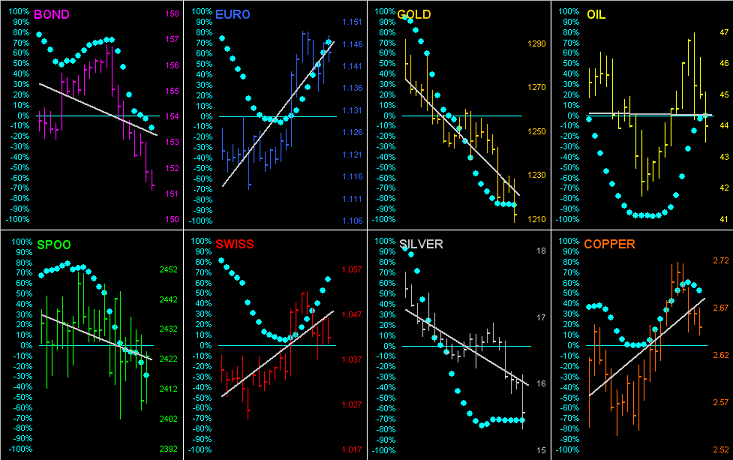
Moreover, the dollar's weakness stands out well here as we turn to the daily bars from a month ago-to-date in going 'round the horn for all eight BEGOS Markets components: note the firm diagonal uptrend lines for both the euro and Swiss franc, whilst gold downwardly dives, even as does silver in spite of industrial metal ally copper having moved higher.
As regular readers know, the baby blue dots denote the consistency of each market's 21-day linear regression trend. And especially with respect to gold, when its "Baby Blues" (which are presently below the -80% level) next begin to curl upward, we'll then anticipate a material, tradable up-leg to be underway:
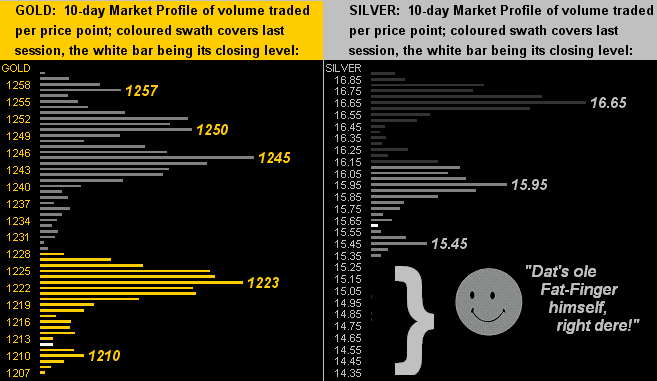
For the precious metals' 10-day Market Profiles, we continue to find price buried well-down for both Gold on the left and Silver on the right. As for the "fat-fingered" trade we saw Thursday afternoon at 16:06 Pacific Time, which drove Sister Silver -11% in just 49 seconds (from 16.065 to 14.340) on almost 5,000 contracts, 'twould appear the "powers that be" judiciously then unwound much of that damage, revising the session's low back up to 15.320, still a significant intra-day wallop of nearly -5%:
In thus turning to how it all stacks up, 'tis perhaps better described as stacks down:
The Gold Stack
Gold's Value per Dollar Debasement, (from our opening "Scoreboard"): 2698
Gold’s All-Time High: 1923 (06 September 2011)
The Gateway to 2000: 1900+
Gold’s All-Time Closing High: 1900 (22 August 2011)
The Final Frontier: 1800-1900
The Northern Front: 1750-1800
On Maneuvers: 1579-1750
The Floor: 1466-1579
Le Sous-sol: Sub-1466
Base Camp: 1377
The Weekly Parabolic Price to flip Long: 1299
2017's High: 1298 (06 June)
Neverland: The Whiny 1290s
The 300-Day Moving Average: 1261 and falling
"The Box": 1240-1280
10-Session “volume-weighted” average price magnet: 1236
Trading Resistance: 1223 / 1245 / 1250 / 1257
Gold Currently: 1212, (expected daily trading range ["EDTR"]: 13 points)
Trading Support: 1210
10-Session directional range: down to 1207 (from 1260) = -53 points or -4%
2017's Low: 1147 (03 January)
Finally, we've these golden observances:
■ When we saw Ken Rapoza's recent Forbes piece which queried "What Are The Odds Of A Stock Market Crash" on the heels of Federal Reserve Bank Chair Janet Yellen ruling out "in our lifetime" another major financial crisis, we stood up in the front row and declared "100%!" No need to rehash the rationale there, you good readers knowing that stock market valuation is double what it ought be, complacency is rife, and to which we above alluded, realizing that money managers don't really have an exit plan in place beyond joining the good ole selling begets selling fray once 'tis well underway. The crash is coming, if for no other conspiratorial theory than to drive the present President from office, the infamous Plunge Protection Team suddenly pulling its plug. Got some gold?
■ Speaking of begetting, in fine concert with our recent concern over electrical circuitry going bad and thus shorting out the very bare essence that begets bitcoin, we read that the large South Korean exchange Bithumb did to a hacking succumb, the data of some 30,000 customers being compromised as it all came undone. Here's a common sense bit: buy some gold.
■ As we all know, our friends in France love their ever so numerous holidays. So now we've the nation's new environment minister, Nicolas Hulot, announcing the sales ban of all petroleum-driven vehicles come 2040, (not to mention also outlawing by that date new projects' use of petroleum, gas, coal and shale oil). So come 2040, should you still be harbouring your old classic sports car, all set to drive off to the beaches of Biarritz, arriving in style in your jaunty buggy, will you even be able to find gasoline, and at what cost? Mama don't take my normally-aspirated internal combustion engine away! As for "Mr. Hulot's Holiday", see Jacques Tati, 1953. 'Tis Golden.
■ Only worse than the inevitable stock market crash, bitcoin going bad, and the end of throaty-sounding exhaust systems would be the boffing of Kentucky bourbon imports into the European Union. That's the G20's spiel should we not take their steel. One ought rightly appeal such deal! To impinge upon the flow of liquid Gold? Say it ain't so! In any event, just buy some gold!