New Gold Bull Market Rally Or A Bull Trap
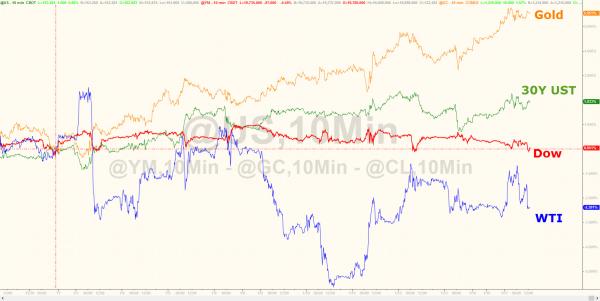
Gold has started 2017 similar to 2016 with a strong performance, as well as outperforming most asset classes year to date. (See chart below). This out performance so far has shocked the market as gold had been under performing the market since Trump won the election in November.
Now that gold has rallied strongly in the first 2 weeks many investors and traders are now wondering if gold will continue its out performance and generate another positive year for gold.

Gold YTD strongly out performing major asset classes. Click chart for source
Gold Monthly Chart Review
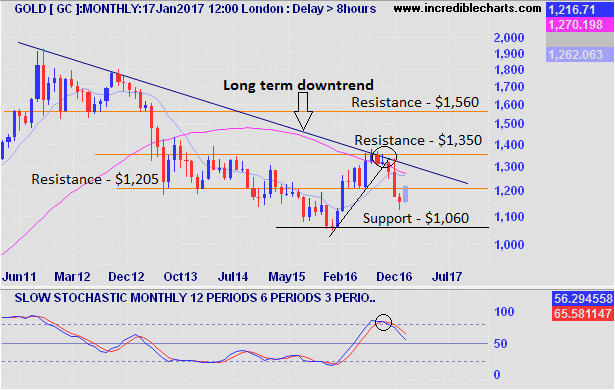
The monthly trend of gold since 2011 does not bode well for the shiny metal over the long term. Since reaching the highs of just over $1,900 some 6 years ago, gold has been on steady decline and still well within its long term downtrend. This is despite recording a positive gain for 2016.
The recent strength of gold in January has pushed the price above resistance of $1,205, which is its first level it needs to close above by the end of the month. With approximately 2 weeks to go before the month is over its early to confirm the break of resistance.
Provided it can sustain the rally in price this month gold will find its next level of resistance along its blue down trend line, which is currently around $1,310 - $1,315.
If Gold were to continue its strong performance over the next few months closing above its downtrend and $1,350 resistance level on a monthly basis. This would result in gold making a reversal of its 6 year downtrend and starting a new bullish uptrend. This scenario I believe is unlikely based on the current trend as well as the technicals.
Monthly Momentum Suggests Rally Is Temporary
Within the monthly chart I have added a Stochastic indicator that measures momentum. I utilize this indicator to assist in determining the overall strength of the trend and for trend reversals.
In 2016 the stochastic momentum was bullish as the gold price for the first 7 months was rising. Once gold stalled and began to fall as it reversed its trend, the Stochastic indicator had crossed over to the downside and began to fall, confirming the uptrend was over. (See circled area within Stochastic indicator)
Observing the stochastic indicator on the monthly chart you can see that momentum continues to head lower suggesting the reversal that started in August last year will continue over the longer term, despite the strong rise of gold this month.
Note: 1. Stochastic Indicator is a lagging indicator. 2. The Stochastic indicator should not be utilized in isolation but rather in conjunction with other indicators to determine direction.

Weekly Gold Chart Review
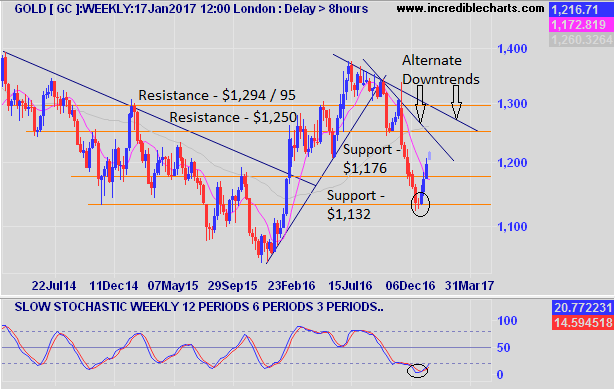
The weekly chart of gold suggests there is potentially more upside coming in the medium term as the price heads towards its weekly alternate downtrends. (See chart below)
Gold comfortably surpassed its prior $1,176 resistance level and now forms as new support level. This new support level is an area to watch out for when Gold retraces.
Key Levels To Watch As Gold Rally's
For investors and traders looking for higher prices for gold, the key areas to watch as it moves higher is the $1,250 resistance level.
In addition its important to note the 2 alternate downtrend lines that have developed to watch out for as overhead resistance. These downtrend levels are $1,240- 45 & $1,285 -90.
Weekly Stochastic Turns Bullish
One of the reasons I believe at least within the medium term that gold will make higher prices is the fact that Stochastic has crossed to the upside and confirms the change of trend within the weekly chart. (See circled areas on chart) This also suggests that momentum is on the bulls side for now.
Most likely target over the coming weeks is for gold to hit resistance level of $1,250 before consolidating, as this target area has previously struggled to initially close above in 2016.
Lastly for the weekly chart review, if gold fails to hold above the $1,176 support level in the coming weeks. Look for gold to retrace all the way back to $1,132 support level.

Gold Daily Chart Review
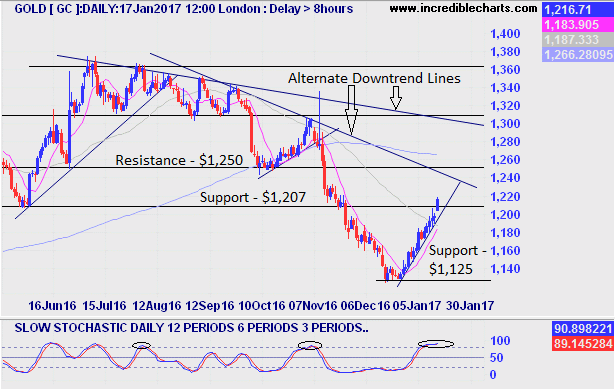
The price action of gold on the daily chart has been very strong over the last 2 weeks, with the vast majority of trading days gold has closed higher as shown by the consecutive blue candles. This sudden burst has created a very sharp uptrend line for gold as shown by the blue trend line at the bottom right of the chart. This is important to note because usually the steeper the trend line in either direction the harder it is to maintain the trend.
Overnight the price closed above $1,207 resistance level and now forms support on a daily basis. The next major level for gold to reach is the $1,250 level of resistance.
However based on the current downtrend that Gold is still trading within, I believe Gold will also find it difficult to close above the resistance of the first downtrend line of $1,242 -44.
Gold's Momentum Approaching Peak Level
The stochastic indicator shows that momentum is still in support of the current rally on the daily chart with blue line above the red line. However the Stochastic indicator in most instances peaks out above the 90 level and eventually begins to fall. I have circled the prior 2 instances this has happened on the daily chart to illustrate what to look out for.
Note: The price action can continue to move higher in the short term if the Stochastic is above 90. It's more ideal to wait for stochastic to cross over and move lower for confirmation of potential reversal of trend.
Summary
From the review of all 3 time frames for gold I believe we will be seeing a consolidation / pullback in the price of gold soon. After a brief consolidation gold will make another attempt to head higher over the medium term.
However the longer term prospects for gold are not as favorable as gold will run into strong resistance around $1,310 - $1,315 level based on the 6 year long downtrend line on the monthly chart.
Therefore the recent strong rally of gold is most likely going to be a bull trap for investors who are holding it for the long term. However if your time horizon is shorter there will be opportunities in 2017.

Thanks for checking out my latest chart review on gold.
Disclaimer: This post was for educational purposes only, and all the information contained within this post is not to be considered as advice or a recommendation of any kind. If you require advice or assistance please seek a licensed professional who can provide these services.
