As many of you fervent Gold followers have already absorbed, the big-mouth banks are now on record as pooh-poohing the precious metals for 2014. With prognosticated ranges for Gold extending to as low as $1,000/oz., the average price as we flow through '14 is forecast by the $treet $ibyls to be in the $1,200/oz. area. Given that we live conditioned in the mediaized land of "well they said it so it must be true", allow us this query:
If Gold in a year's time is to be at best 'round where 'tis today, why not simply bail out straight away and bankroll the proceeds into a one-year Treasury Note, the current yield-to-maturity of which is 0.14%? Not only shall you sleep assured that by the full faith and credit of the U.S. Treasury you'll receive the Note's par value in a year's time, but moreover: on every $1,000 Note you purchase you'll effectively earn $1.40 (before transaction costs).
'Tis, I suppose, perhaps a daft choice to opt for that T-Note after all, especially given an S&P 500 proven to have risen better than 27% in less than one year. That's certainly to stay in vogue, non? But then: there's the Terrible Taper...
You can always tell when the holidays are nigh: everybody wants to get into the act, including the tapir, (a pack of which I wouldn't mind seeing set loose in the hallowed investment banking hallways amongst the Armani-suited Gold Shorts, a filmed event which ought go viral).
But the chaos borne of the unknown amount, if any, and timing of a reduction by the Fed in quantitative easing (QE) seems the sole force that is driving the major markets' directions these days, hardly one of which goes by without the expectations for tapering being either "On!" or "Off!" What to do?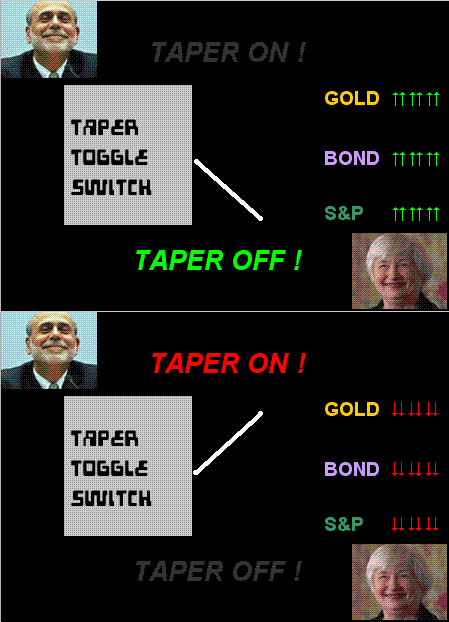
What to do is allow the intercession of logic: hang on to one's Gold, indeed employ some of the astute acumen of the Asian nations who continue to accumulate the yellow metal given its attractive pricing. In support of such logic, let's assess the rationale, or lack thereof, by one of those investment banks for Gold's price to remain subdued in 2014. Quote:
"...inflation remains low and [the Dollar] has not debased..." Ok, you be the judge: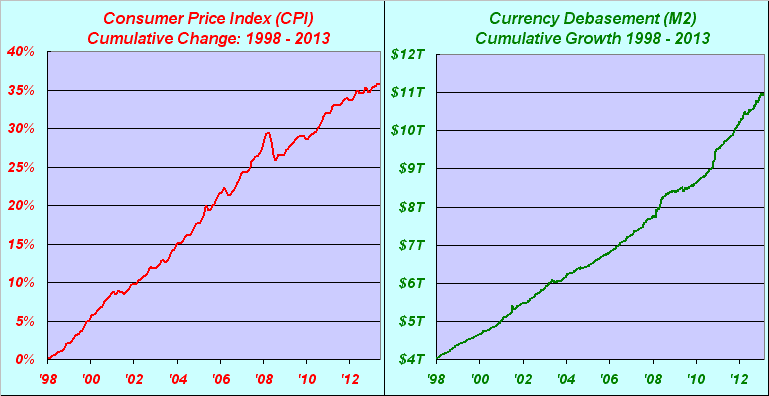
"You can rest your case, mmb"
Oh thank you, Your Honour. (Looks like Squire's received a promotion). Indeed in the case for Gold per the above two-panel graphic, the defense rests.
But the analysis continues: in just the second instance since the end of August, Gold this past week made both a "higher low" and a "higher high", a marvel which now through 50 weeks year-to-date has occurred but a scant 16 times. As for the parabolic flip price ratcheting down another notch, the 1345 level—as noted in the following chart—last traded during the week of Labor Day. Also, the chart's declining parabolic red dots have accelerated to a current pace of -15 points per week, meaning that in a week's time they'll be around 1330 and then down toward 1315 in closing out the year.
Gold's current price of 1238 (at time of writing) is 77 points below that extrapolated year-end parabolic leve—and Gold's weighted-average weekly trading range right now is 53 points. Therefore, 'tis conceivable and 'twould be lovely indeed to end the year with a flip from Short to Long. But 'twill take some "umpffff" on the Buy Side to get there: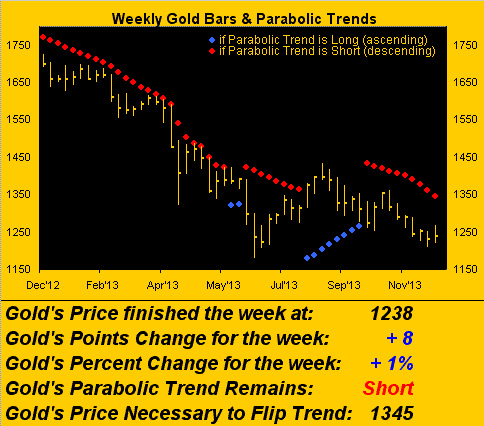
If you've breezed by the site of late, you may have seen that amongst the eight markets that comprise BEGOS (Bond, Euro/Swiss, Gold/Silver/Copper, Oil, S&P) the precious metals are currently exhibiting the largest increases in daily volatility. Directly from our Market Ranges page , here are the current "expected daily trading ranges" for both Gold (24 points per day) and Silver (0.58 points per day):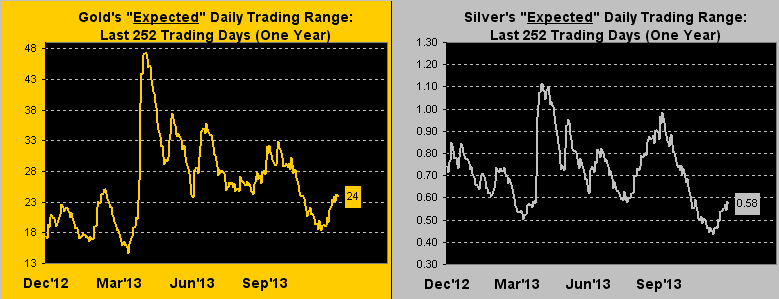
Again, the above graphic depicts expected range (not price direction). Nonetheless, the action right now in the metals is picking up, as opposed to that in our similar charts for the other six BEGOS markets which show their own ranges as narrowing.
Further evidence of the comparative pickup in the metals' volatility is next displayed in tracking the percentage performances of Gold vs. the S&P over the last month (21 trading days). The greater amplitude of trading is clearly in Gold: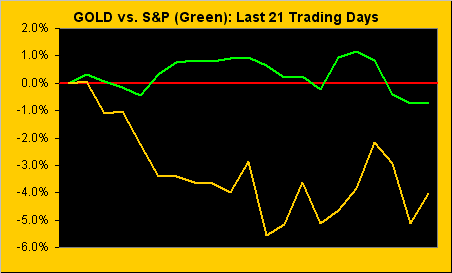
'Course, amplitude for the S&P ought well pick up once "Look Ma No Earnings Crash" takes hold. As one headline this past week put it: "Hedge funds attract billions in new money; Investor inflows jump sharply even as [earnings] performance lags stocks." Nuff said. (Note: Bob Shiller's inflation-adjusted P/D is current 25.0x; our "live unweighted" P/E using trailing 12 months is 25.8x ... and cap-weighted 'tis 63.2x ... really).
Here's some more evidence of the S&P's running out of puff whilst Gold is trying to turn 'round. Regular readers and site visitors are familiar with what we call the "Baby Blues", a series of daily blue dots that measure a market's 21-day linear regression trend consistency. This is a powerful analytic as it puts early focus on a pending change in trend, prior to confirmation that it has in fact changed. Per the next chart, for the trader with time horizons of several days to a few weeks, one might consider a Long position in a market upon its consistency curling higher after being below the -80% level, (placing a stop below the most recent low), or a Short position upon consistency curling lower after being above the +80% level, (placing a stop above the most recent high). You may recall in last week's Gold Update the Baby Blues for both Gold and Silver were just beginning to ascend, whilst those for the S&P were already in descent. For the week, the metals rose and the S&P fell.
Now as we're driving into year's end, rather than show the usual one month or one quarter view, here we've the full year-over-year track of the Baby Blues for both Gold and the S&P on a single chart, (using coloured lines rather than the blue dots so as to avoid confusion). What we're seeing right now is quite telling: the S&P's 21-day uptrend has ceased, the green line have dropped to 0%, (meaning its 21-day price track is now trendless). Gold's 21-day trend remains down because its line in the chart is sub-0%, but the important bit is this: the line's being in ascension means that each 21-day set of price points is plotting further away from the trendline itself and therefore the consistency of Gold's downtrend is breaking apart, suggesting that 'tis en route to shifting up, (upon a confirmed crossing above 0%):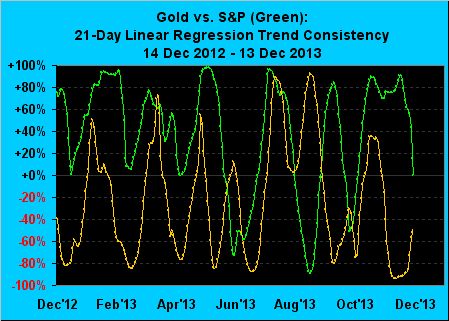
'Tis said: "Trade the news and you'll lose your shoes, but trade the Blues and you'll make the news." I know, a shameless plug. Let's press on with the Gold profile: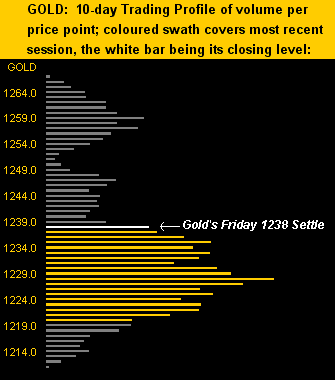
Not a bad picture, that. Friday, price per the above Golden swath recovered nicely after Thursday's thorough test of support at both 1228 and 1222. Having now settled above that broad support shelf opens the door to go for those upper apices at both 1247 and then 1259. However, I first wouldn't rule out a re-testing of that underlying support, because one of our better Market Rhythms at the moment—the 8-hour MACD (moving average convergence divergence) study—is negatively disposed per this final graphic. Again, note how regularly rhythmic are the MACD's crossovers: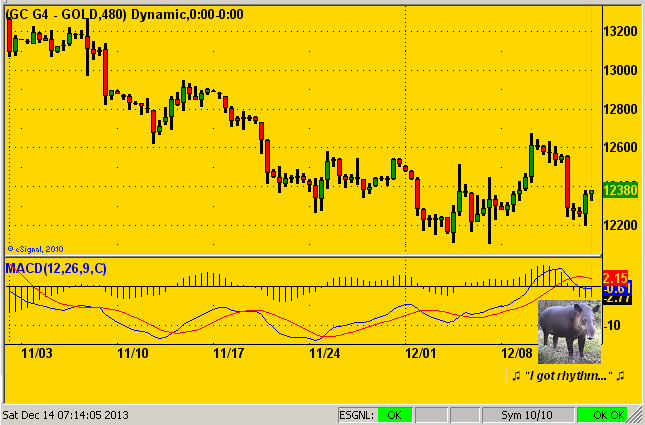
Oh brother. Who's coming to your holiday party?
On the way out, these three quick hits from the Fiat Fiscal Follies:
1) Washington's budget wranglings have produced a deal that would purportedly reduce our StateSide federal deficit by $23 billion over 10 years; QE is currently running at $23 billion every eight days!
2) The EuroZone Yo-Yo is in full spin: Slovenia’s banks need €4.8bn in new capital, whilst Croatia is also struggling to make headway. But far away and across the Channel, Ireland is set to exit the EU's rescue program, and better still, finance minister Michael "The Face" Noonan says he may cut income taxes to help boost growth. Now yer thinkin', Mikey!
3) And finally we've the year-end Fiat Finale featuring the FOMC's policy decision followed by Big Ben's final career press conference thereto on Wednesday. Watch for increased Gold and Silver volatility and mind that Taper Toggle Switch!