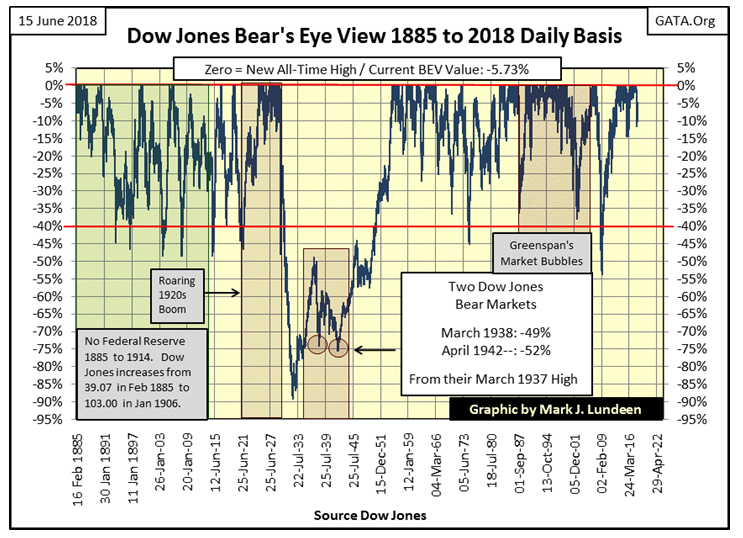
I thought I’d start out with the Dow Jones’ Bear’s Eye View (BEV) chart going back to 1885 showing every bear market decline of the past one hundred thirty-three years. This week ended with the Dow Jones 5.73% from its last all-time high of January 26th, which is pretty darn good from the perspective of Mr Bear’s View of the market.
Mr Bear doesn’t care about how many points the Dow Jones, or anything else rises. The only thing the big furry fellow cares about is how many percentage points he can claw back from the gains the bulls have made. But points do matter to us, even if we don’t see them in the BEV chart below. Knowing since 09 March 2009 the Dow Jones had advanced over 20,000 over the past nine years suggests, to suggestable minds like mine, that the stock market at current valuations is vulnerable to a significant market decline.
That’s why I posted a long term BEV chart for the Dow Jones this week to give us a clue of the possible for the next market decline; not if, but when it comes.

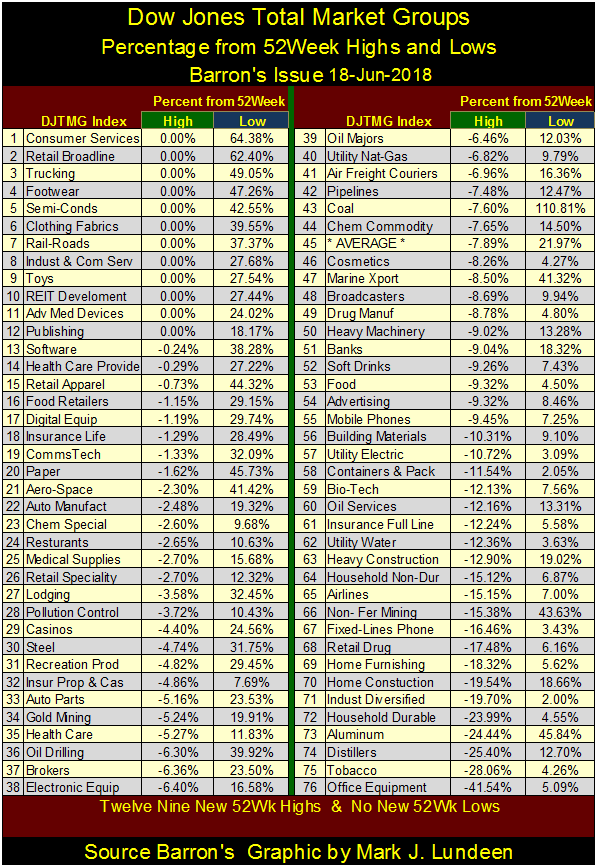
Here’s the latest data of the 52Wk Highs and Lows for the Dow Jones Total Market Group (DJTMG). A 0.00% in the green 52Wk High column shows a 52Wk High, a 0.00% in the blue 52Wk Low column shows a 52Wk Low, with twelve new 52Wk Highs and no new 52Wk Lows this week.
We naturally look to the 52Wk Highs (Green Column) to see which groups are outperforming the rest. However, data from the blue 52Wk Low column is key in understanding which groups are really leading the way upward. For instance – which group has outperformed all others in the past 52 weeks?

The answer to that question is found at #43/Coal, which at the end of this week finds itself at a whopping 111% above its 52Wk Low, while only 7.6% below its 52Wk High.
Last week I made the case for avoiding over inflated assets at a market top, as such investments will prove to be low hanging fruit for Mr Bear when he returns to feed on Wall Street. I recommended investments that were deflated as others inflated during the post Credit-Crisis advance – precious metals and their miners.
But looking at the below BEV chart for the coal miners, and knowing that President Trump has taken the Federal Government’s jack boot off of the neck of the coal miners, I think coal mining can be added to this list of deflated assets to own in the coming deflation in the financial markets.
To read the entire report Please click on the pdf File Below:
