Briefly: In our opinion, no speculative positions in gold, silver and mining stocks are justified from the risk/reward point of view. In other words, we think that taking the rest of the profits off the table is justified from the risk to reward point of view. It seems likely that we will re-enter the short positions shortly, though.
The precious metals sector moved higher yesterday, while the USD index declined. There was no meaningful action in gold – it remains below the previous 2015 lows – but silver invalidated its recent breakdown and the USD Index invalidated its recent breakout. Is gold the key market to focus on, or are other markets just as important and can change the outlook for gold on their own?
The reality is that many more markets impact the gold market than just gold itself; however, gold itself remains the most important one (we did the math behind the above and will present a corresponding report in the following months). Before moving on to the conclusions, let’s take a look at the charts (charts courtesy of http://stockcharts.com).

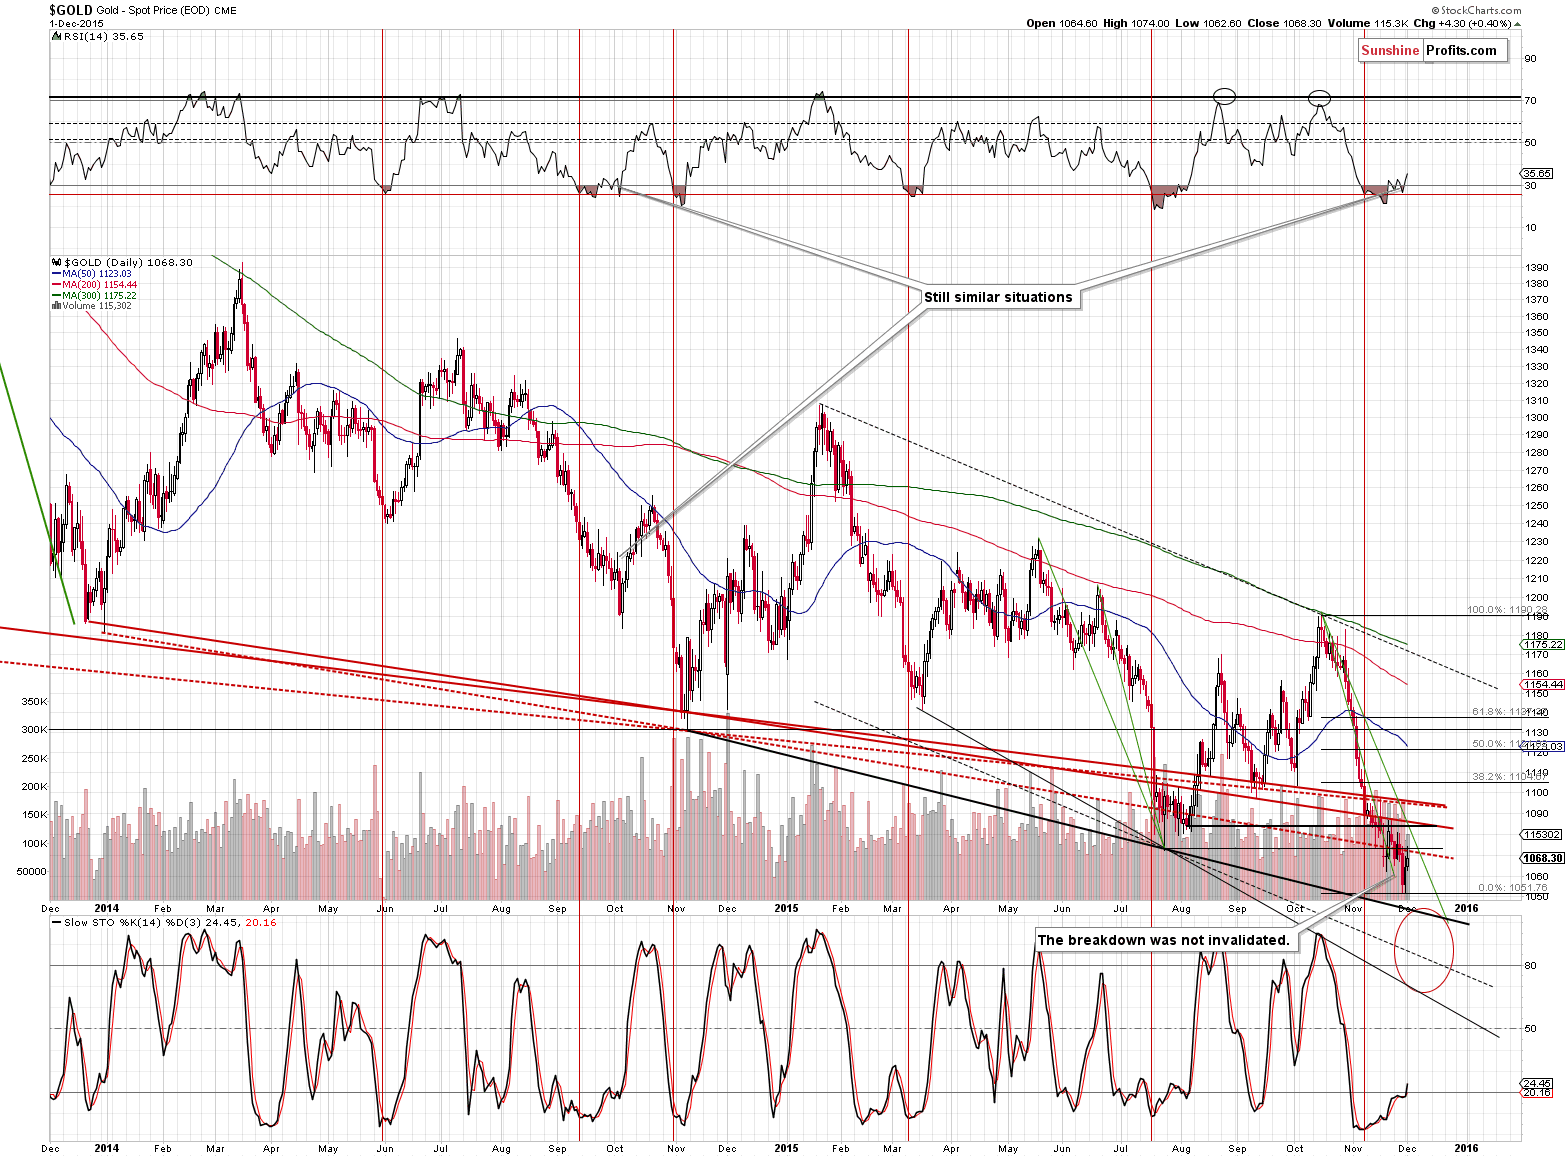
We can once again say that gold moved a bit higher yesterday, but ultimately closed well below the previous lows. Consequently, there was no invalidation of Friday’s breakdown and the bearish implications thereof remain in place.
Moreover, please note that it was once again the case that gold moved higher on low volume, which has bearish implications.

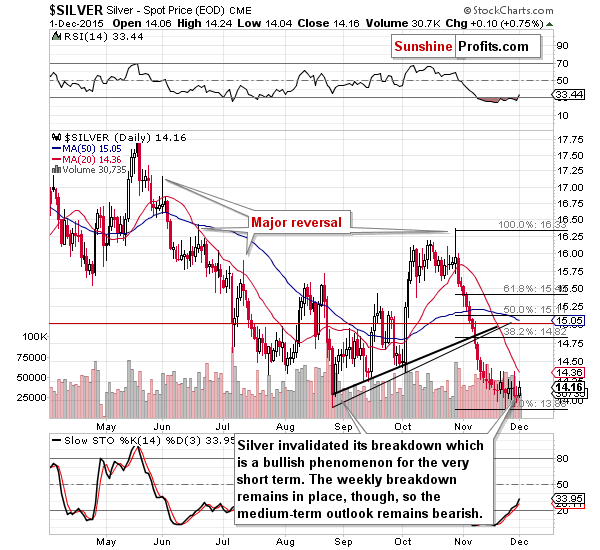
On Friday and Monday, silver closed below the previous 2015 low (in terms of daily closing prices), and the implications were bearish, but not extremely bearish. In yesterday’s alert we wrote the following:
Silver moved lower by just one cent yesterday, but it’s actually much more significant than it seems at the first sight. After all, that was the second daily close below the previous low. Just one more close below $14.08 and the breakdown will be confirmed and the implications will be very bearish.
There was no additional daily close below $14.08. Instead, yesterday silver moved higher and closed the day at $14.16. This move was small, but the implications are important because, after all, it was the previous breakdowns’ invalidation. Invalidations mean that the market is not strong enough (at a given time) to hold the broken level and this indicates that the market is likely to move the other way in the following days.
There’s one more thing that one needs to keep in mind – silver’s technical signs are quite often invalidated if they are not confirmed by the rest of the precious metals sector. Consequently, the above observation (the invalidation of the breakdown below previous low in terms of daily closing prices) is not a game changer on its own – the fact that gold didn’t invalidate its breakdown is more important. Plus, silver didn’t invalidate the breakdown in terms of weekly closing prices, which is still a very important bearish factor for the following weeks.
Overall, the situation in silver became more bullish for the short term, but not significantly so and this change actually changes little for the medium and long term.

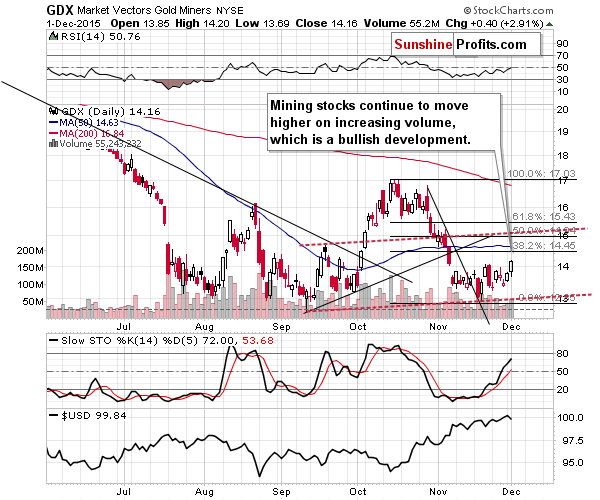
Mining stocks (N:GDX) moved higher once again and the move higher was accompanied by rather significant (and rising) volume, which is a bullish combination. The general stock market rallied yesterday, which could be the reason for the above outperformance (of mining stocks vs. gold), but nonetheless, the above is at least a somewhat bullish factor for the precious metals sector.

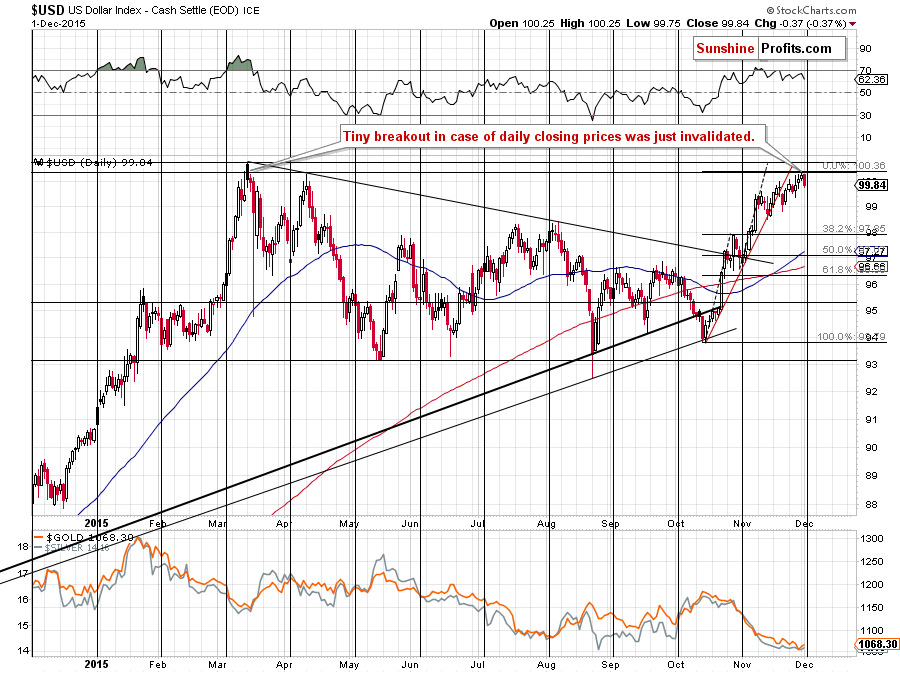
The final chart for today features the USD Index. In Monday’s alert, we wrote the following regarding the above:
Unfortunately, the short-term outlook is not as clear. The USD Index broke a little above the previous high (in terms of the daily closing prices), but the breakout is not confirmed. Will the USD confirm the breakout and rally further? Eventually or within the next several weeks – very likely, but it’s unclear whether this happens in the next several days. The USD’s cyclical turning point is here and given the current rally, the implications are bearish.
On the other hand, as we saw on the previous long-term chart, the USD is already after a sizable consolidation and it’s likely to move higher, so it could be the case that we will see a breakout shortly.
If we see a breakout, how high can the USD rally before correcting? It’s likely to rally to about 102 as that’s where we have the 61.8% Fibonacci retracement of the entire 2001 – 2008 slide.
How low can the USD Index go if it doesn’t manage to hold its recent gains? Probably to 98 or so (July and August highs).
The USD Index just moved below the 100 level and closed there, which means that its previous breakout above the previous 2015 high was invalidated. This has bearish implications for the USD Index and bullish implications for the precious metals sector. At the moment of writing these words, the USD Index is back at 100.04, but this move above 100 is both tiny and not confirmed by a daily close, so overall the situation is still more bearish than not.
Summing up, the outlook for the precious metals market is still more bearish than not for the short term, but at this time – based on the several short-term bullish factors – it seems that it’s only a little more bearish. With the odds of a continuation of the decline in the short term at about 55% - 60% or so, it doesn’t seem that keeping even a small short position is justified from the risk to reward point of view. Consequently, we are taking profits off the table with the remaining half of the current position and we are closing it. In short, the position had been opened with gold at about $1,150 and we closed the first half thereof based on the Nov. 27 prices (gold: $1,056.10) and we are closing the remaining half today (gold is at about $1,067 at the moment of writing these words). We expect to be back on the short side of the market shortly (unless we see strong bullish signals, which might make us go long, like it was the case on Jul. 27). Moreover, we will update our gold and silver performance page shortly.
To be clear – we think that this is an interim bottom and not the final bottom for this medium-term decline in the precious metals sector, and we think that after a corrective upswing another big (probably final) slide lower will take place.
To summarize:
Trading capital (our opinion): No positions
Long-term capital (our opinion): No positions
Insurance capital (our opinion): Full position
Please note that a full position doesn’t mean using all of the capital for a given trade.
As a reminder – “initial target price” means exactly that – an “initial” one, it’s not a price level at which we suggest closing positions. If this becomes the case (like it did in the previous trade) we will refer to these levels as levels of exit orders (exactly as we’ve done previously). Stop-loss levels, however, are naturally not “initial”, but something that, in our opinion, might be entered as an order.
Since it is impossible to synchronize target prices and stop-loss levels for all the ETFs and ETNs with the main markets that we provide these levels for (gold, silver and mining stocks – the GDX ETF), the stop-loss levels and target prices for other ETNs and ETF (among other: O:UGLD, O:DGLD, O:USLV, O:DSLV, N:NUGT, N:DUST, N:JNUG, N:JDST) are provided as supplementary, and not as “final.” This means that if a stop-loss or a target level is reached for any of the “additional instruments” (DGLD for instance), but not for the “main instrument” (gold in this case), we will view positions in both gold and DGLD as still open and the stop-loss for DGLD would have to be moved lower. On the other hand, if gold moves to a stop-loss level but DGLD doesn’t, then we will view both positions (in gold and DGLD) as closed. In other words, since it’s not possible to be 100% certain that each related instrument moves to a given level when the underlying instrument does, we can’t provide levels that would be binding. The levels that we do provide are our best estimate of the levels that will correspond to the levels in the underlying assets, but it will be the underlying assets that one will need to focus on regarding the sings pointing to closing a given position or keeping it open. We might adjust the levels in the “additional instruments” without adjusting the levels in the “main instruments”, which will simply mean that we have improved our estimation of these levels, not that we changed our outlook on the markets. We are already working on a tool that would update these levels on a daily basis for the most popular ETFs, ETNs and individual mining stocks.
As a reminder, Gold and Silver Trading Alerts are posted before or on each trading day (we usually post them before the opening bell, but we don't promise doing that each day).
