
Economic and political risks appear to be rising, but the global stock market remains resilient in terms of maintaining a strong year-to-date performance, based on an exchange-traded fund. Within the major components of this global ETF proxy, however, lies a dramatic evolution of leaders and laggards in recent weeks.
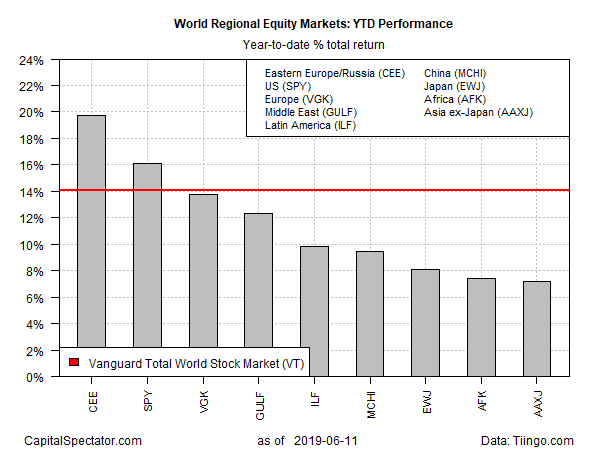
From a top-down perspective, the 2019 rally appears relatively steady and is holding on to nearly all of this year’s gains via Vanguard Total World Stock (NYSE:VT), which is up 14.1% year-to-date through yesterday’s close (June 11). Note that VT’s increase this year eclipses all but two of the major equity regions: only Eastern Europe/Russia (Central and Eastern Europe Fund (NYSE:CEE) and US stocks via SPDR S&P 500 (NYSE:SPY) are posting higher gains. Otherwise, the remaining regions of the world are trailing VT, a global benchmark, this year. (Note: CEE, a closed-end fund, is currently the only US-exchange-listed portfolio targeting Eastern Europe and Russia.)
Is Recession Risk Rising? Monitor the outlook with a subscription to:
The US Business Cycle Risk Report
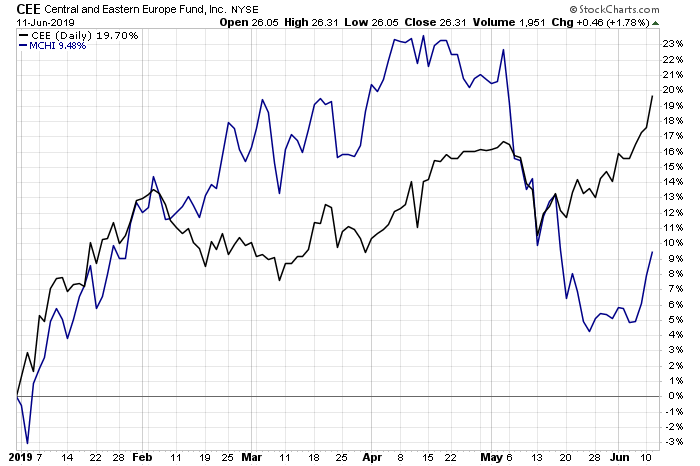
Within the main components of the world stock market, there’s been a conspicuous rotation of leadership. The formerly high-flying Chinese market (iShares MSCI China ETF (NASDAQ:MCHI) has retreated over the past month-plus, ceding its year-to-date leadership to Central and Eastern Europe Fund (CEE).
The ongoing trade conflict between the US and China has taken a toll on China’s stock market, as defined by MCHI. After a stellar rally in 2019 through the end of April, the ETF began to hit turbulence amid rising concerns that Washington and Beijing were at loggerheads over resolving a trade dispute – a dispute that appears no closer to resolution at the moment.
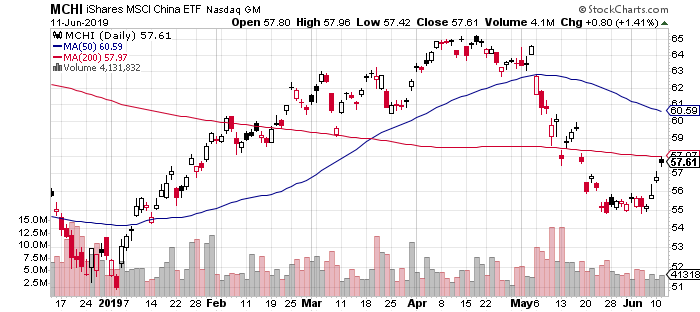
The possibility of a meeting later this month with President Donald Trump and his Chinese counterpart, Xi Jinping, offers a ray of hope. But as Reuters notes, expectations are low for the talks between the two leaders at the upcoming G20 summit on June 28-29 in Japan. “The atmosphere is poisonous,” remarks a senior Beijing-based Western diplomat.
The US-China trade battle is raising the risk of a worldwide economic slowdown, say analysts and business leaders. For example, US multinational Cisco (NASDAQ:CSCO) Systems’ Chuck Robbins earlier this week said: “My biggest fear is that what is going between the US and China may impact the global economy, and desires that the US-China get a reasonable resolution as soon as possible which will be good for customers and economy.”
If the impasse between the US and China rolls on, weaker growth is a likely outcome, warns Olaf Scholz, the German finance minister. “We all hope there will be a way out of these trade tensions. Because every one of us knows that our fundamental economic data are influenced by the insecurity of this situation. As an indirect effect of these insecurities, companies postpone their decisions to invest.”
A complicating factor that’s come into play in recent days: the Hong Kong protests, which are directed against passing a bill that allows extraditions to mainland China. The political unrest in the city, a major financial center for the world economy, is raising concerns about the future of this quasi-independent city-state. “The business and financial community is deeply concerned about what this may augur for Hong Kong,” says Fred Hu, founder of the investment firm Primavera Capital Group.
Meanwhile, a momentum profile of the funds listed above continues to reflect a weaker trend generally via two sets of moving averages. The first definition compares the 10-day moving with the 100-day average, a measure of short-term trending behavior (red line in the chart below). A second set of moving averages (50 and 200 days) offers an intermediate measure of the trend (blue line). The indexes range from 0 (all funds trending down) to 1.0 (all funds trending up). Based on this data through yesterday’s close, the bullish climate from earlier in the year remains challenged with a softer trend. But while several components of the global equity market are showing weakness, the overall market via VT remains relatively resilient, at least for now.
