Gold tops $4,500, Japan stabilizes, U.S. data in focus— what’s moving markets

Mixed messages from the data It’s hard to know what to make of yesterday’s data. On the one hand, the Bundesbank was telling us recently that growth was slowing in Germany, but on the other hand, yesterday’s July PMIs for Europe – particularly Germany -- exceeded expectations. There was a similar mixed picture in the US. On the one hand, jobless claims in the week of July 19 plummeted to the lowest level since 2006, both for the latest result and the 4-week moving average. You might expect that better employment conditions would mean a better housing market as people who are more confident about their futures go out and buy homes, but on the contrary: the previously reported 19% spike in new home sales to 504,000 in May saw a record revision down all the way to 442,000, and then June fell further to 406,000, the lowest figure since March. All told, the data seems to have clouded the picture more than clarified it. The market’s conclusion though seems to have been to take it all positive: Bund and Treasury US 10 Year T-Note yields both rose about 3 bps, while Fed Funds expectations for three years from now rose 6.5 bps. The higher US rate expectations supported USD, which was unchanged to higher against all the G10 currencies except SEK. AUD dropped the most of any of the G10 currencies, with no particular news behind the fall, perhaps just profit-taking after the recent rise. The rise in SEK was fairly inexplicable as it follows the higher-than-expected unemployment and fall in producer prices for June that were announced yesterday.
Japan’s inflation seems to be cooling. The national CPI for June slowed to 3.6% yoy from 3.7% in the previous month (although this was higher than the forecast of 3.5%), while the Tokyo CPI eased to 2.8% yoy from 3.0%. On the other hand, the core CPIs (excluding fresh food and energy) were both higher: national rose to 2.3% yoy from 2.2% while Tokyo rose to 2.1% from 2.0%, suggesting that firms may still be passing some of the increase in the consumption tax onto consumers. Imported inflation, particularly with regards to energy prices, should cool as the yen is no longer falling so much on a year-on-year basis. The yen’s trade-weighted index was down around 4% yoy in July, vs -13% in January. The Bank of Japan’s base scenario is that inflation will pick up towards the end of the year, but if this doesn’t happen – as seems likely – they may have to take further easing steps. The yen is likely to weaken further as more and more investors anticipate such a move, in my view.
Today: There are several major indicators out today. The German Ifo current assessment index and expectations index are both expected to decline, which could weaken EUR/USD. The Ifo index is in contrast to Thursday’s positive PMI figures, perhaps because the Ifo incorporates more recent data on the impact that sanctions on Russia are likely to have on the German economy.


In the UK, the nation’s preliminary GDP for Q2 is estimated to have remained unchanged in pace at 0.8% on a quarterly basis. This will drive the yoy rate up to +3.1% from +3.0%. Such a strong growth figure could be a reason for the pound to regain momentum following Thursday’s weak retail sales data.
From the US, durable goods orders for June are expected. The headline figure is forecast to rise +0.5% mom, a turnaround from -0.9% mom the previous month, likewise, durable goods excluding transportation equipment are estimated to have risen +0.5% on a mom basis, after May’s 0.0% mom. Overall these figures are positive and the dollar could strengthen if they come in as anticipated.
We have no speakers scheduled on Friday.
The Market
EUR/USD virtually unchanged

EUR/USD rebounded from 1.3435 (S1) on Thursday, but the advance was halted by 1.3485 (R1) and the pair moved lower to trade virtually unchanged. The price structure remains lower highs and lower lows below both the moving averages, while rate traded below the 1.3500 barrier for a third consecutive day. Nevertheless, although I still see a negative short-term picture, taking a look on our momentum studies I would remain to the sidelines for today. The MACD, although negative, moved above its trigger line, while the RSI exited its oversold zone and moved higher, amplifying the case for further consolidation or an upside corrective move, maybe to test the validity of the 1.3500 (R1) line as a resistance this time.
• Support: 1.3435 (S1), 1.3400 (S2), 1.3350 (S3).
• Resistance: 1.3485 (R1), 1.3500 (R2), 1.3580 (R3).
EUR/JPY rebounds from 136.40

EUR/JPY rebounded from 136.40 (S1) and at the time of writing is testing the 50-period moving average. The rate remains below the resistance of 137.35 (R1), also below the downtrend line, and this keeps the near-term downtrend intact. However, I see positive divergence between the price action and both our momentum studies, while on the daily chart I can identify a possible morning doji star formation, magnifying the case for the continuation of the upside corrective wave. I would wait for trend continuation signals before expecting the continuation of the downtrend, since in my view, is not the better time to follow it.
• Support: 136.40 (S1), 136.20 (S2), 135.50 (S3).
• Resistance: 137.35 (R1), 138.45 (R2), 138.75 (R3).
GBP/USD dips below 1.7000

GBP/USD fell below the 1.7035 barrier, which coincides with the 200-period moving average, and also dipped below the psychological barrier of 1.7000 (R1), which matches with the 32.8% retracement level of the 29th May – 15th of July advance. Yesterday’s decline confirms the signs of topping, mentioned in previous comments. Having that in mind and also considering that the rate lies within a downside channel, I would adopt a negative stance as far as the short-term trend is concerned. Nonetheless, on the daily chart, the 80-day exponential moving average continues to provide reliable support to the lows of the price action. This keeps the long-term path to the upside and as a result, I would see the near-term downtrend as a corrective phase of the major uptrend.
• Support: 1.6950 (S1), 1.6918 (S2), 1.6880 (S3).
• Resistance: 1.7000 (R1), 1.7035 (R2), 1.7100 (R3).
Gold reaches and breaks 1293

Gold continued declining, reaching the 1293 barrier, which coincides with the 50% retracement level of the 5th of June – 10th July uptrend, and breaking below it. The yellow metal is now likely to challenge the next support at 1285 (S1), where a clear break could open the way towards the 1265 (S2) zone. The MACD remains below both its zero and signal lines, indicating bearish momentum, but the RSI hit 30 and moved somewhat higher. Bearing that in mind, I cannot rule out further consolidation near the current levels before sellers regain control again.
• Support: 1285 (S1), 1265 (S2), 1258 (S3).
• Resistance: 1293 (R1), 1305 (R2), 1315 (R3).
WTI declines after finding resistance at 103.35

WTI fell sharply on Thursday after finding resistance at 103.35 (R1). The unsuccessful attempt of the bulls to overcome that barrier is worrisome and as a result I would remain flat for now. At the time of writing, the price seems ready to challenge our support barrier of 101.75 (S1), where a clear dip would confirm a forthcoming lower low and probably flip the outlook to the downside. Such a move is likely to pave the way towards our next support level at 100.70 (S2). The RSI moved below 50, while the MACD fell below its signal line, confirming yesterday’s negative momentum. Moreover, negative divergence is identified between the price action and both the momentum studies, increasing the likelihood for the dip below 101.75 (S1).
• Support: 101.75 (S1), 100.70 (S2), 98.65 (S3).
• Resistance: 103.35 (R1), 104.50 (R2), 105.45 (R3).
BENCHMARK CURRENCY RATES - DAILY GAINERS AND LOSERS

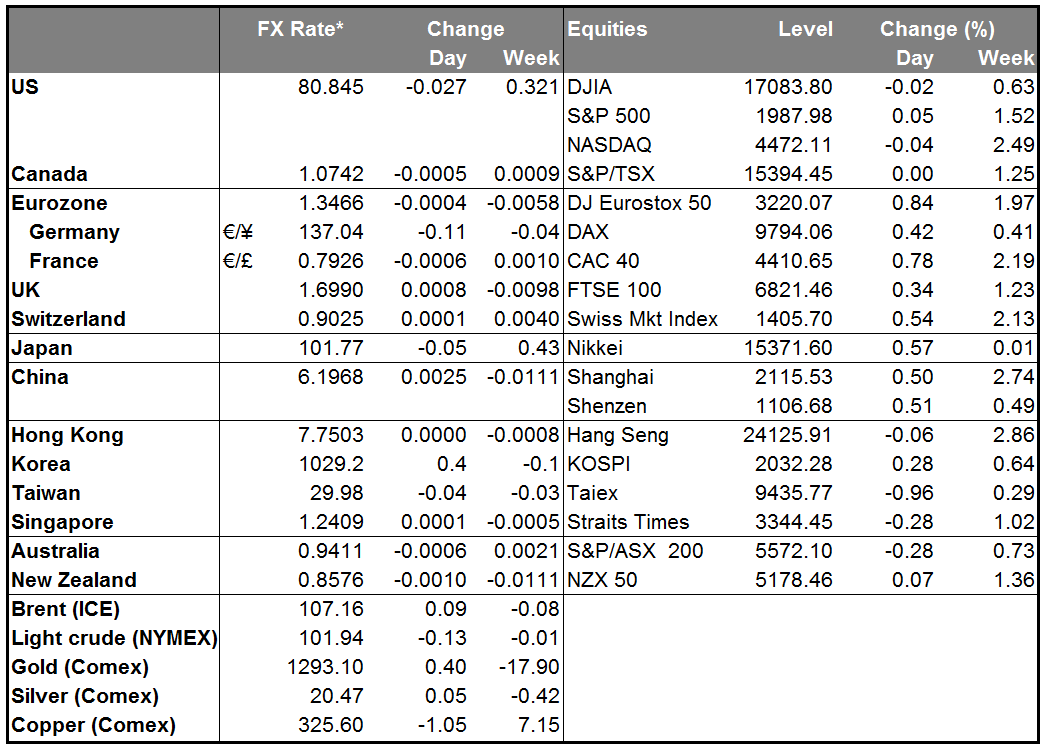
MARKETS SUMMARY