Get 40% Off
👀 👁 🧿 All eyes on Biogen, up +4,56% after posting earnings. Our AI picked it in March 2024.
Which stocks will surge next?
Unlock AI-picked Stocks

General Mills Bearish Elliott Wave Cycle Spells Trouble

Published 10/29/2020, 06:18 AM
Updated 07/09/2023, 06:31 AM

The last time we wrote about General Mills (NYSE:GIS) stock was over a year and a half ago. Following a bullish reversal Elliott Wave analysis helped us correctly predict in late-December 2018, the stock was trading above $51 a share in late-March 2019.

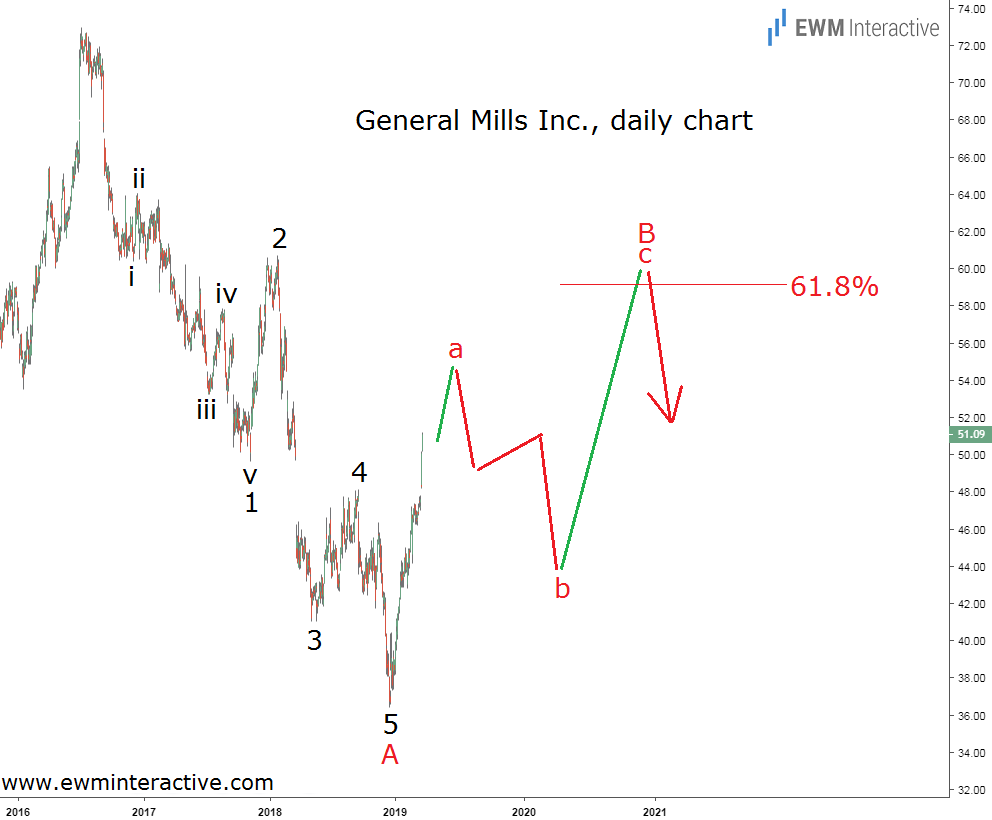
It was a 33% recovery, whose structure, however, didn’t look quite as anticipated. It was supposed to be a three-wave correction, following a textbook impulsive decline from $72.95. Instead, it was an almost straight line to the north from $36.42. So, on March 26th, 2019, we published the chart below in an attempt to prepare for what lies ahead.
General Mills Stock Chart

The speed and sharpness with which General Mills moved to the upside only meant a bigger three-wave pattern was developing in wave B. The 1-2-3-4-5 structure of wave A was very clear, so we could keep relying on this count as long as its starting point remained intact.

Fibonacci Resistance Discouraging General Mills Bulls

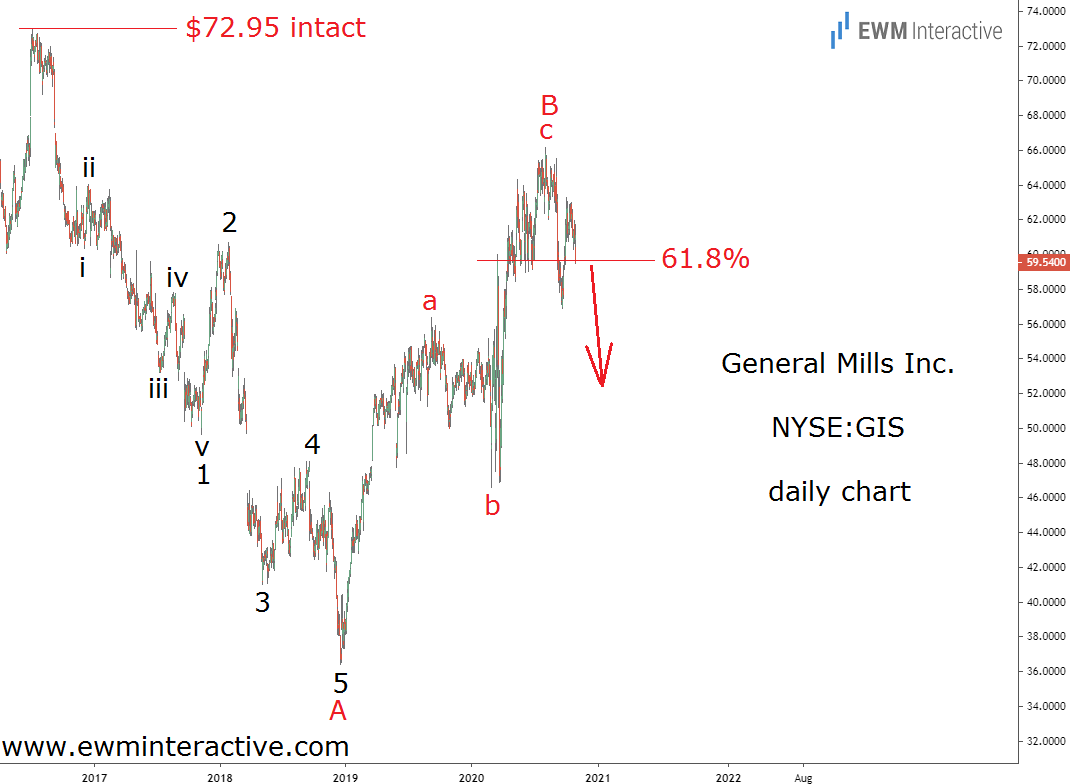
Whenever a deep retracement is unfolding it pays to keep an eye on the 61.8% Fibonacci level. Corrections often end shortly after reaching it. On the daily chart of General Mills stock it stood at roughly $60 a share. On the other hand, a notable three-wave drop in wave ‘b’ of B was supposed to occur before the bulls could reach that target. The updated chart below shows how things turned out.
General Mills Stock Daily Chart

Wave ‘a’ of B climbed to $56.40 in September 2019, when wave ‘b’ started. It reached bottom during the March 2020 carnage, but the bulls took over again to lift the stock to $66.14 this August. The 61.8% level has been breached, but $72.95 is untouched, which means the 5-3 wave cycle is still valid.

3rd party Ad. Not an offer or recommendation by Investing.com. See disclosure here or remove ads .

Now, we have a complete impulsive decline in wave A, followed by a clear a-b-c zigzag in wave B. If this count is correct, another selloff in wave C can be expected. The bears should drag General Mills below the bottom of wave A. Currently near $60, a drop to sub-$36 means the stock can lose ~40% of its value in the months ahead.

Original Post

Latest comments

Risk Disclosure: Trading in financial instruments and/or cryptocurrencies involves high risks including the risk of losing some, or all, of your investment amount, and may not be suitable for all investors. Prices of cryptocurrencies are extremely volatile and may be affected by external factors such as financial, regulatory or political events. Trading on margin increases the financial risks.
Before deciding to trade in financial instrument or cryptocurrencies you should be fully informed of the risks and costs associated with trading the financial markets, carefully consider your investment objectives, level of experience, and risk appetite, and seek professional advice where needed.
Fusion Media would like to remind you that the data contained in this website is not necessarily real-time nor accurate. The data and prices on the website are not necessarily provided by any market or exchange, but may be provided by market makers, and so prices may not be accurate and may differ from the actual price at any given market, meaning prices are indicative and not appropriate for trading purposes. Fusion Media and any provider of the data contained in this website will not accept liability for any loss or damage as a result of your trading, or your reliance on the information contained within this website.
It is prohibited to use, store, reproduce, display, modify, transmit or distribute the data contained in this website without the explicit prior written permission of Fusion Media and/or the data provider. All intellectual property rights are reserved by the providers and/or the exchange providing the data contained in this website.
Fusion Media may be compensated by the advertisers that appear on the website, based on your interaction with the advertisements or advertisers.
© 2007-2024 - Fusion Media Limited. All Rights Reserved.