Get 40% Off
👀 👁 🧿 All eyes on Biogen, up +4,56% after posting earnings. Our AI picked it in March 2024.
Which stocks will surge next?
Unlock AI-picked Stocks

GBP/JPY And NZD/USD Analysis – April 24, 2018

Published 04/24/2018, 05:43 AM
Updated 03/21/2024, 07:45 AM

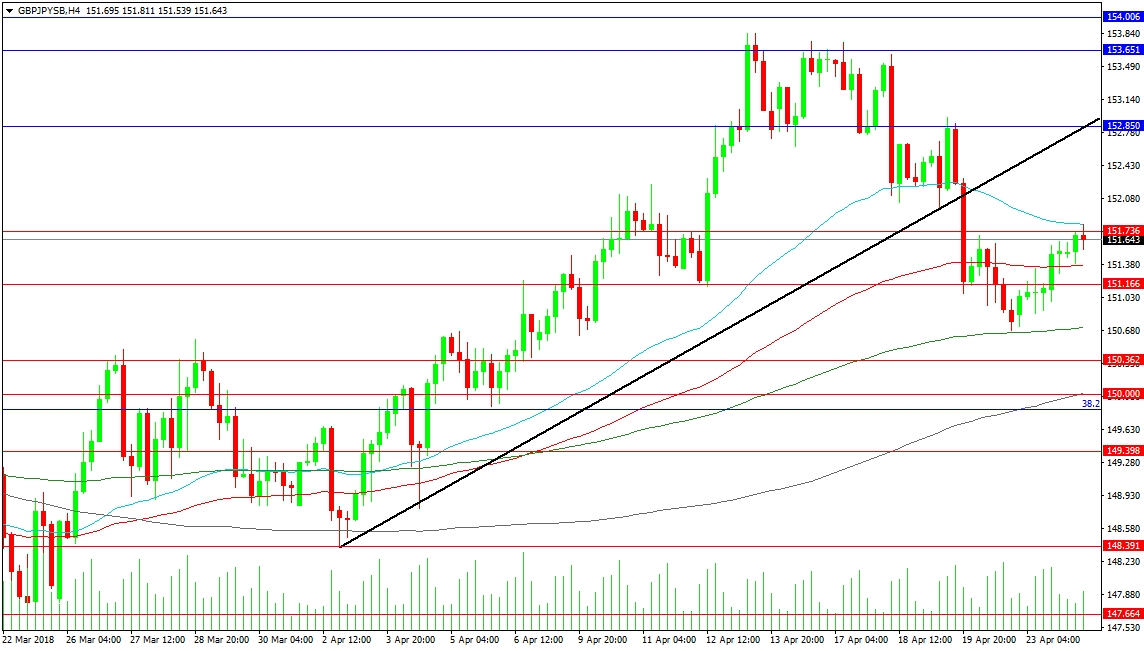
The GBP/JPY pair has dropped back, after breaking the supporting trend line at the 152.100 level last week. The fall lower has found support at the 200-period MA at 150.655 and, today, price has retraced higher to resistance at the 50-period MA at 151.807. A break above this area would retarget the trend line at the 152.850 level and then the area of resistance between 153.651 and 154.000. A break higher above that point would look to reach the 165.000 level.

Support can be seen at the moving averages including the 100-period at 151.375. There is support at the previous highs at 150.500, with a loss of this level opening the way for a test of 150.00. The 149.398 level was an area of consolidation used in March. Supports under this area come from previous higher lows at 148.391 and 147.664.

GBP/JPY 4-Hour Chart

NZD/USD

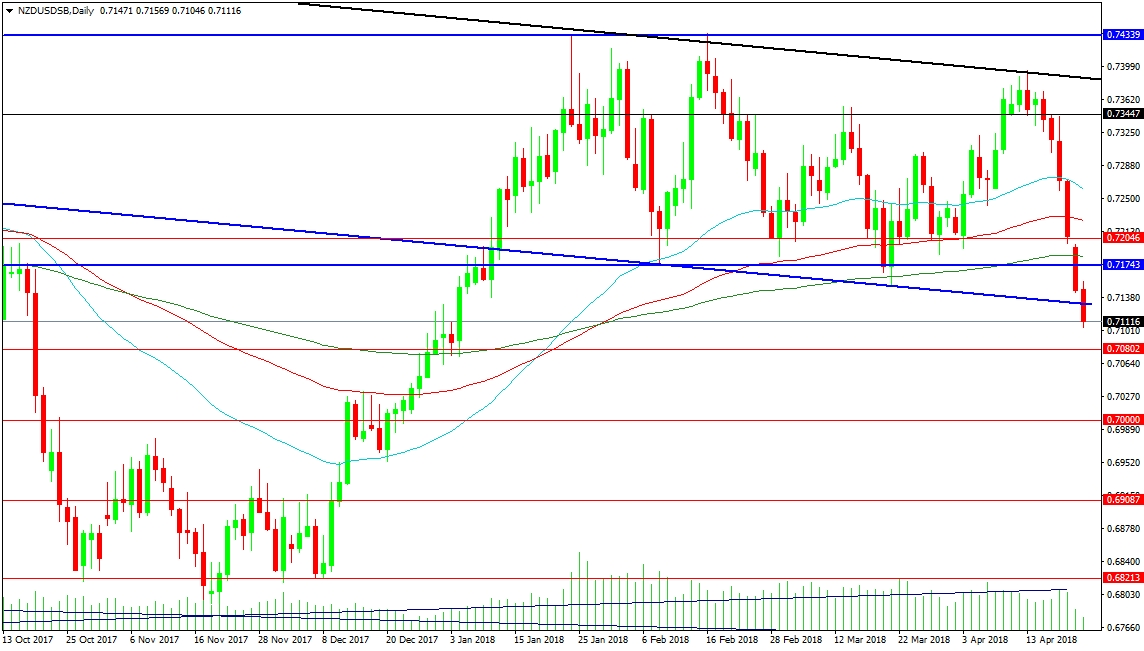
This pair has broken the supporting trend line today, leading to a sixth day of declines. The moving averages have been broken, with the 50-period used as resistance on Friday. Further declines target 0.70802, followed by 0.70000. This is a major level and price will need to stay above it to maintain any chance for long traders, but it will attract interest all the same. A loss of the level targets 0.69087 and 0.68213, where an area of support has developed extending down to 0.67500.

Resistance comes in at the 0.71743 level, with the 200-period MA at 0.71853. The 0.72046 level may provide light resistance, with a move higher testing the 50 DMA at 0.72606. A successful move up over this moving average puts long traders back in control and targets resistance at 0.73447 and the falling black trend line at 0.73865. The high at 0.74340 would be needed to eliminate any chance of a double top forming, with a target at 0.69100.

3rd party Ad. Not an offer or recommendation by Investing.com. See disclosure here or remove ads .

NZD/USD Daily Chart

By Edward Anderson, FxPro Analyst

Latest comments

Risk Disclosure: Trading in financial instruments and/or cryptocurrencies involves high risks including the risk of losing some, or all, of your investment amount, and may not be suitable for all investors. Prices of cryptocurrencies are extremely volatile and may be affected by external factors such as financial, regulatory or political events. Trading on margin increases the financial risks.
Before deciding to trade in financial instrument or cryptocurrencies you should be fully informed of the risks and costs associated with trading the financial markets, carefully consider your investment objectives, level of experience, and risk appetite, and seek professional advice where needed.
Fusion Media would like to remind you that the data contained in this website is not necessarily real-time nor accurate. The data and prices on the website are not necessarily provided by any market or exchange, but may be provided by market makers, and so prices may not be accurate and may differ from the actual price at any given market, meaning prices are indicative and not appropriate for trading purposes. Fusion Media and any provider of the data contained in this website will not accept liability for any loss or damage as a result of your trading, or your reliance on the information contained within this website.
It is prohibited to use, store, reproduce, display, modify, transmit or distribute the data contained in this website without the explicit prior written permission of Fusion Media and/or the data provider. All intellectual property rights are reserved by the providers and/or the exchange providing the data contained in this website.
Fusion Media may be compensated by the advertisers that appear on the website, based on your interaction with the advertisements or advertisers.
© 2007-2024 - Fusion Media Limited. All Rights Reserved.