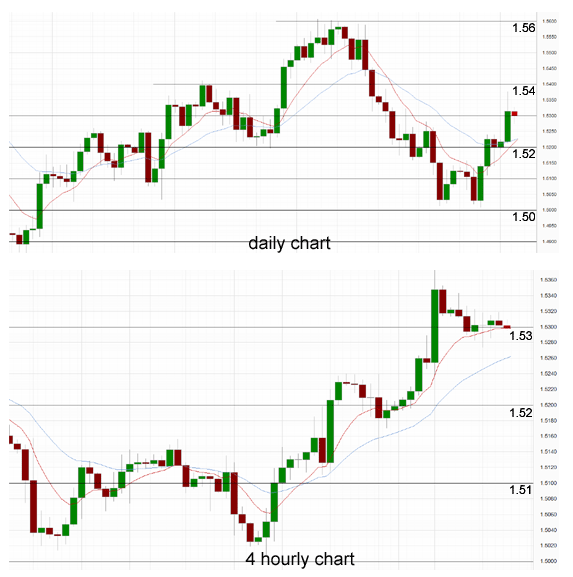
After a really solid last week, the GBP/USD has just eased off a little and rested on the support at the 1.53 level. In the last day, it had experienced its strongest 24 hour period in a while as it surged up through 1.53 to within reach of 1.54 and a new three week high. At the end of last week the pound did well to surge higher and move back through the 1.52 before easing off slightly. In doing so, it moved through 1.5150 which it had previously experienced some difficulty with over the last week or so. Over the last couple of weeks it has also received solid support from 1.50 which has given it the opportunity to rally higher and move back above 1.52 again. During last week however, it did move to a lower level and therefore reached a new two month low close to 1.50 before the strong surge higher over the last week. For a few days a couple of weeks ago it found some support around 1.5160 however this level was clearly broken as it fell down towards 1.50. Then throughout last week the area around the 1.5160 level was providing some resistance as the pound continued to try and rally higher.
There might be some signs now that it is recovering from its horrible May which saw it drop from 1.56 down to the two month low near 1.50. Moving through 1.53 sees the pound having regained half of the previous losses. Prior to the last month, the pound enjoyed a strong couple of weeks and move to new highs above 1.56. It experienced all sorts of bother at 1.56 as it made several pushes to this significant level however it was turned away with excessive supply. For about a week it ran into a wall of resistance right around the 1.56 level. The pound had enjoyed a very solid couple of weeks moving from the support level at 1.52 to reach new highs at 1.56, a new ten week high. Back around mid April the pound experienced solid support at 1.52 for about a week which greatly assisted the recent surge higher, and recently this level was called upon again to offer some support and a soft landing, however the pound fell strongly through it on its way down to near 1.50. A couple of weeks ago, we saw some evidence that the decline had been slowed down as it traded around 1.52 for about a week whilst receiving solid support from around 1.5160.
Throughout the month of May saw the pound fall strongly and return almost all of its gains from the few weeks before that. About a month ago the 1.54 level provided a little piece of resistance and this level has since been broken as it offered limited support. In early March the pound moved to new lows around 1.4830 from a starting point near 1.64 at the beginning of the year. With the surge higher throughout March and April, the GBP/USD had completely turned around its fortunes from earlier in the year, however May saw ease off and return most of the good work.
The pound started the week on the right foot, gaining ground after a positive UK Manufacturing PMI. The key index barreled across the 50-point level for the first time since February, posting a reading of 51.3 points. This was above the estimate of 50.3 points. This was followed on Tuesday by another strong PMI, as UK Construction PMI pushed above the 50-point line, for the first time since August 2012. The key indicator climbed from 49.4 points to 50.8 points, surpassing the estimate of 49.7 points. A reading above 50 indicates expansion, so this reading was certainly good news for the markets. Will Wednesday’s Services PMI follow suit?
GBP/USD June 5 at 01:45 GMT 1.5296 H: 1.5326 L: 1.5273
During the early hours of the Asian trading session on Wednesday, the GBP/USD is consolidating within a narrow range right around the key 1.53 level after having recently eased back a little from resistance near 1.5350. Throughout the first part of this year, the pound fell very strongly from the key resistance level at 1.63 level down to levels not seen in two and a half years and has done well the last month to rally well and move back up above 1.56. Current range: Right around 1.53.
Further levels in both directions:
• Below: 1.5200 and 1.5000.
• Above: 1.5350, 1.5400 and 1.5600.
(Shows the ratio of long vs. short positions held for the GBP/USD among all OANDA clients. The left percentage (blue) shows long positions; the right percentage (orange) shows short positions.)
The GBP/USD long positions ratio has remained above 50% after the GBP/USD has surged higher through the 1.53 level. Trader sentiment remains in favour of long positions.
Economic Releases
- 01:30 AU GDP (Q1)
- 07:58 EU Services & Composite PMI (May)
- 08:28 UK CIPS/Markit Services PMI (May)
- 09:00 EU GDP (2nd Est.) (Q1)
- 09:00 EU Retail Trade (Apr)
- 12:15 US ADP Employment Survey (May)
- 12:30 CA Building permits (Apr)
- 12:30 US Non Farm Productivity (Final) (Q1)
- 12:30 US Unit Labour Costs (Final) (Q1)
- 14:00 US Factory Orders (Apr)
- 14:00 US ISM Non-Manufacturing (May)
- 18:00 US Beige Book released