
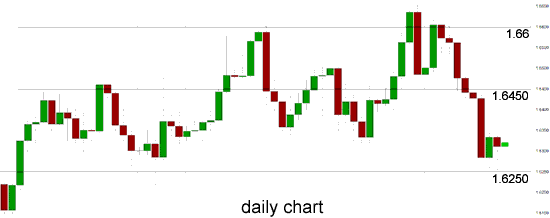
Over the last few days the GBP/USD has been able to steady and hold ground above the support level at 1.6250 and rally a little back towards 1.6350. Over the last week the pound fell sharply and experienced its worst one week fall this year which has resulted in moving to the six week low near the current support level at 1.6250. Over the last couple of months the pound has established and traded within a trading range roughly around the key level of 1.6450, whilst moving down to support at 1.6250 and up to 1.66. Over the last few weeks or so the pound has moved very strongly pushing through resistance levels at 1.6450 and more recently at 1.66 however it has since returned those gains. The 1.66 level has become quite significant as it had been looming large over the last month or so and a couple of weeks ago it moved through, reaching a new multi-year high close to 1.6670. Since that time however it has retraced strongly and moved back below the 1.66 level only to be rejected again over the last week before falling sharply again to below 1.6450.
Several weeks ago it rallied again trying to break through the 1.6450 level before dropping back to a support level at 1.6350. In late November it did well to break through the long term resistance level at 1.6250 which had established itself as a level of significance over the last few months. This level continues to play a role in providing support. In early November, the pound bounced strongly off the support level at 1.59 to return back to above 1.6250. Towards the end of October the GBP/USD slowly drifted lower from the strong resistance level at 1.6250 and down to a three week low just around 1.5900 which was recently passed as the pound moved down towards 1.5850 only a week ago. For the week or so before that the pound moved well from the key level at 1.60 back up to the significant level at 1.6250, only again for this level to stand tall and fend off buyers for several days.
Throughout September the pound rallied well and surged higher to move back up strongly through numerous levels which was punctuated by a push through to its highest level for the year just above 1.6250 several weeks ago. In the first week of October the pound was easing back towards 1.60 and 1.59 where it established a narrow trading range between before surging back to 1.6250 again.
There were no surprises from the BOE, which kept its asset purchase facility and interest rate levels unchanged. QE remains pegged at 375 billion pounds, while the benchmark interest rate stays at 0.50%. With the British economy showing marked improvement, there is pressure on the BOE to raise interest rates, but Governor Mark Carney has balked until now. We'll get a look at the BOE Inflation Report and the Unemployment Rate later in the month, and if these key indicators are positive, speculation will increase about a rate hike. British PMIs were the focus this week. Services PMI dropped slightly to 58.3 points, missing the estimate of 59.1 points. Construction PMI looked very sharp, rising to 64.6 points, its highest level since August 2007. This easily beat the estimate of 61.6 points. Earlier in the week, Manufacturing PMI looked weak, dipping to 56.7 points and falling short of the estimate of 57.1 points.
 GBP/USD Daily Chart" title="GBP/USD Daily Chart" width="474" height="218">
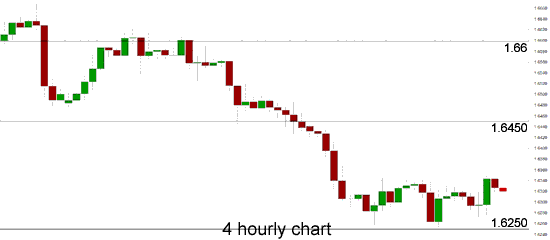 GBP/USD 4 Hourly Chart" title="GBP/USD 4 Hourly Chart" width="474" height="240">
GBP/USD February 6 at 22:45 GMT 1.6314 H: 1.6348 L: 1.6272
GBP/USD Technical
| S3 | S2 | S1 | R1 | R2 | R3 |
| 1.6300 | 1.6250 | 1.5900 | 1.6600 | --- | --- |
During the early hours of the Asian trading session on Friday, the GBP/USD continues to trade in a small range between 1.6300 and 1.6350 after recently rallying higher from the support level at 1.6250. Current range: Right above support at 1.63 at 1.6320.
Further levels in both directions:
• Below: 1.6300, 1.6250 and 1.5900.
• Above: 1.6600.
OANDA’s Open Position Ratios
![]()
(Shows the ratio of long vs. short positions held for the GBP/USD among all OANDA clients. The left percentage (blue) shows long positions; the right percentage (orange) shows short positions.)
The GBP/USD long positions ratio continues to rise and move closer to 40% as the GBP/USD falls sharply back down towards 1.63. Trader sentiment remains in favour of short positions.
Economic Releases
- 00:30 AU Statement on Monetary Policy
- 05:00 JP Leading indicator (Prelim.) (Dec)
- 09:30 UK Industrial Production (Dec)
- 09:30 UK Manufacturing Production (Dec)
- 09:30 UK Trade Balance (Dec)
- 13:30 CA Net Change in Employment (Jan)
- 13:30 CA Unemployment (Jan)
- 13:30 US Non-farm & Private Payrolls (Jan)
- 13:30 US Unemployment (Jan)
- 15:00 UK NIESR GDP Est. (Jan)
- 20:00 US Consumer Credit (Dec)