GBP/USD for Friday, December 20, 2013
The GBP/USD has continued its slide from the last week and reached a three week low but at the same time it has returned to a likely support level at 1.6250 which was solid resistance for some time. In the last 24 hours it has consolidated around 1.6350 after its wild swings from the last few days. The pound didn't enjoy last week very much as it returned all of its gains from the previous couple of weeks which had it moving from down below 1.6250 to the present resistance level at 1.6450. Over the last few days it has been content to consolidate around the 1.63 level and move very little before dropping lower in the last 24 hours. A few weeks ago it did well to break through the long term resistance level at 1.6250 which had established itself as a level of significance over the last few months. Prior to that the pound had bounced strongly off the support level at 1.59 to return back to its present levels. Towards the end of October the GBP/USD slowly drifted lower from the strong resistance level at 1.6250 and down to a three week low just around 1.5900 which was recently passed as the pound moved down towards 1.5850 only a week ago. For the week or so before that the pound moved well from the key level at 1.60 back up to the significant level at 1.6250, only again for this level to stand tall and fend off buyers for several days. Throughout September the pound rallied well and surged higher to move back up strongly through numerous levels which was punctuated by a push through to its highest level for the year just above 1.6250 several weeks ago. In the first week of October the pound was easing back towards 1.60 and 1.59 where it established a narrow trading range between before surging back to 1.6250 again.
Back in the middle of August the pound surged higher to through the resistance level at 1.56 to a then two month high around 1.5650, before spending the next few days consolidating and trading within a narrow range around 1.5650, receiving support from the key 1.56 level. A couple of months ago the resistance level at 1.54 was proving to be quite solid, and once it broke through the pound surged higher to a new seven week high near 1.56 in a solid 48 hour period run. In the week leading up to this the pound had recovered strongly and returned to the previous resistance level at 1.54 after the week earlier undoing some of its good work and falling away sharply from the resistance level at 1.54 back down to around 1.5150 and a two week low. A few weeks ago the 1.54 resistance level stood firm and the pound fell away heavily, however the 1.51 support level proved decisive and helped the pound rally strongly.
Earlier in July after having done very little for about a week, the GBP/USD started to move and surge higher and move through the 1.52 and 1.53 levels to the one month high above 1.54. Prior to the move higher, it moved very little as it found solid support at 1.51 and traded within a narrow range above this level. It established a trading range in between 1.51 and 1.52 after it took a breather from its excitement just prior when it experienced a strong surge higher moving back to within reach of the 1.52 level from below 1.49, all in 24 hours. About a month ago it did well to climb off the canvas and move back above 1.49 and towards 1.50 again before seeing the pound reverse and head back down below 1.49 to reach a new multi-year low near 1.48. It experienced sharp falls moving from 1.53 down to the key long term level of 1.50 and then through 1.49. That movement saw it resume its already well established medium term down trend from the second half of June and move it to a four month low.
British retail sales rose last month recovering from a fall in October, helped by shoppers buying warm clothes after a mild start to autumn, official data showed on Thursday. Retail sales volumes were up 0.3 percent on the month, the fastest monthly growth in the month of November since 2010, to show 2.0 percent expansion on the year, the Office for National Statistics said. Economists in a Reuters poll had expected retail sales to rise 0.3 percent on the month after a fall in October, and for sales to be 2.3 percent higher on the year. Textiles, clothing and footwear sales volumes jumped 3.8 percent in November from October, the ONS said. That helped offset a fall of 3.1 percent in department stores sales and weaker fuel sales. At the same time, a record amount of goods were bought on line, accounting for 11.9 percent of all retail sales, excluding fuel. Earlier this month, the British Retail Consortium, an industry group, said sales in November made a slow start to the month but picked up as the colder weather prompted consumers to shop for warmer clothes. On Wednesday, another survey, by the Confederation of British Industry, suggested retail sales rebounded in December as shoppers started splashing out for the Christmas holidays after a weak November and October. GBP/USD Daily Chart" title="GBP/USD Daily Chart" width="551" height="239">
 GBP/USD 4 Hourly Chart" title="GBP/USD 4 Hourly Chart" width="551" height="239">
GBP/USD December 19 at 22:50 GMT 1.6364 H: 1.6389 L: 1.6335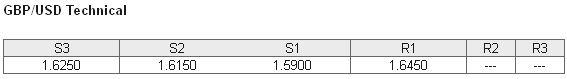 GBP/USD Technical Chart" title="GBP/USD Technical Chart" width="551" height="239">
During the early hours of the Asian trading session on Friday, the GBP/USD is continuing to do very little as it consolidates around 1.6360 after it wild swings to well above 1.6450 and then back down below 1.64 the previous day. To start this year the pound fell very strongly from near 1.64 down to below 1.50 however the second half of the year has seen it recover strongly and move beyond 1.64 to new highs. Current range: Just above the support level at 1.6250 around 1.6270.
Further levels in both directions:
• Below: 1.6250, 1.6150 and 1.5900.
• Above: 1.6450. GBP/USD Position Ratios Chart" title="GBP/USD Position Ratios Chart" width="551" height="239">
(Shows the ratio of long vs. short positions held for the GBP/USD among all OANDA clients. The left percentage (blue) shows long positions; the right percentage (orange) shows short positions.)
The GBP/USD long positions ratio remains well below 30% as the GBP/USD eases back from 1.6450. Trader sentiment remains heavily in favour of short positions.
Economic Releases
- 09:30 UK Current Account (Q3)
- 09:30 UK GDP (Final) (Q3)
- 09:30 UK Index of Services (Oct)
- 09:30 UK Public Borrowing (PSNB ex interventions) (Nov)
- 13:30 CA CPI (Nov)
- 13:30 CA Retail Sales (Oct)
- 13:30 US Core PCE Price Index (3rd Est.) (Q3)
- 13:30 US GDP Annualised (3rd Est.) (Q3)
- 13:30 US GDP Price Index (3rd Est.) (Q3)
- 15:00 EU Flash Consumer Sentiment (Dec)
- JP BoJ MPC - Overnight Rate (Dec)
- US S&P Index Quarterly Review become effective