Markets were trading cautiously yesterday after the initial positive sentiment flipped led by declines in oil. ADP payrolls report yesterday showed 172k jobs being added to a better than expected jobless claims as well, feeding the optimism into today's nonfarm payrolls report for June, widely anticipated to show a rebound following the weak numbers in May.
The US Dollar Index trades precariously above the 96 level, with resistance at 96.5 to the upside and support at 95.
EUR/USD Daily Analysis

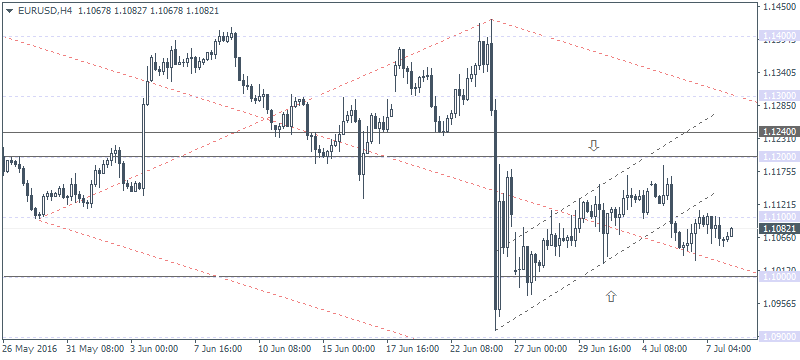
EUR/USD (1.108) closed at 1.1062 yesterday after a test to 1.110. Price action has formed an inside bar and a breakout from Wednesday's range of 1.1115 high and 1.10291 low could signal further continuation.
The longer term resistance and support levels of 1.120 and 1.10 remain in place which could be targeted on a breakout off the inside bar. On the 4-hour chart, price action has been consolidating following the breakout from the bearish flag pattern and below 1.110 price level which has been acting a minor resistance level.
While the bias remains to the downside, watch for any potential bear traps as EUR/USD has not completed the correction to 1.120. Only a confirmed break below 1.10 will signal further continuation to the downside.
USD/JPY Daily Analysis

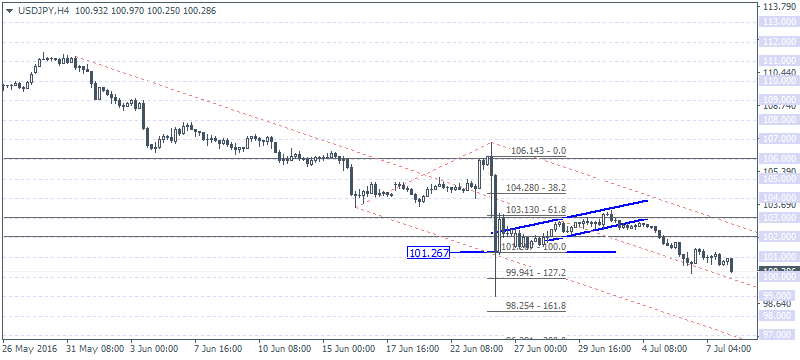
USD/JPY (100.28) closed with an inside bar yesterday following Wednesday's price rejection near the lows of 100 yen. Currently, USD/JPY is seen extending declines back to the 100 yen which could hold up as support.
102.00 now comes in as a resistance level with further upside likely only on a breakout above 102. To the downside, below 100, USD/JPY could be looking to test 99.95 followed by 98.26 - 98.0 lower support. It will also confirm the completion of the measured move target of the bearish flag pattern.
GBP/USD Daily Analysis

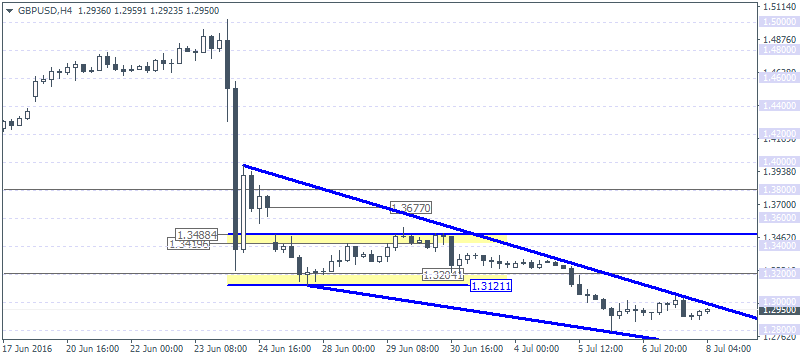
GBP/USD (1.295) is seen trading within 1.30 and 1.28 levels on the daily chart. The retest of the 1.312 - 1.32 previous support remains. A correction to this level to establish resistance could well confirm the downside in GBP/USD which could see a renewed decline to the downside.
The price action on the 4-hour chart shows a consolidation taking shape in a descending wedge pattern, where a breakout above 1.30 could see GBP/USD extend its gains towards 1.312 - 1.30 levels.
A close above 1.32 could keep the gains intact and see GBP/USD move back into its previous range with the next resistance at 1.34 coming into the picture. To the downside, only a break below 1.28 will see further declines.
Gold Daily Analysis

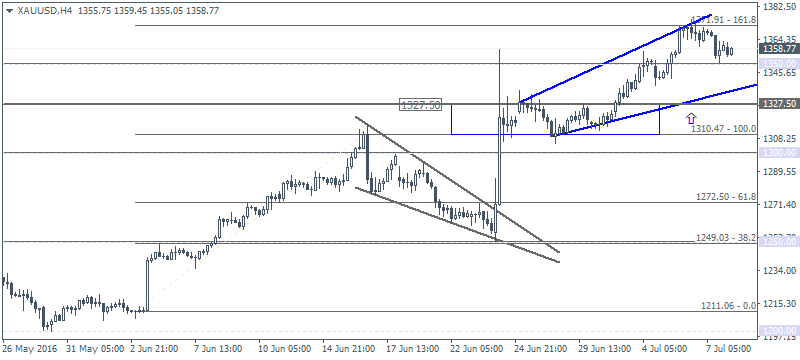
XAU/USD (1358.77): Gold prices closed with a spinning top yesterday, but price remains above the $1350 handle. On the 4-hour chart, we notice gold prices declining and briefly sliding to just above the $1350 support.
We can expect to see some near term consolidation within the broadening wedge pattern. Further gains or declines can be seen on an upside breakout above 1371 and a break of support at 1350. Below 1350, gold prices could be seen targeting 1327.50 major support.
