
April 29, 2013 – GBP/USD (daily chart) has attempted to continue its upside recovery from late last week, when price broke out cleanly above key resistance in the 1.5400 price region. This previous resistance level was also around the 38.2% Fibonacci retracement of the long plummet from the 1.6337 high in the very beginning of the year to the 1.4830 low in mid-March. After having broken out above 1.5400 last Thursday, the following day saw a continuation of the upside momentum. This week, Monday’s price action saw a high at 1.5545 before pulling back to the downside.
With the key 1.5400 price region now serving as tentative support within the current recovery attempt, major upside resistance currently resides around the 1.5600 price region, which is in the vicinity of the 50% Fibonacci retracement of the noted decline from the beginning of the year. In the event of a breakout above that level, which would further extend the upside recovery, a key price objective resides around the 1.5750 price region, around the 61.8% Fibonacci retracement level.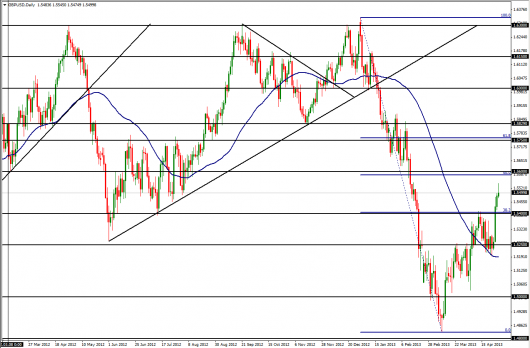 GBP/USD" title="GBP/USD" width="530" height="348">
Disclosure: FX Solutions assumes no responsibility for errors, inaccuracies or omissions in these materials. FX Solutions does not warrant the accuracy or completeness of the information, text, graphics, links or other items contained within these materials. FX Solutions shall not be liable for any special, indirect, incidental, or consequential damages, including without limitation losses, lost revenues, or lost profits that may result from these materials.
The products offered by FX Solutions are leveraged products which carry a high level of risk to your capital with the possibility of losing more than your initial investment and may not be suitable for all investors. Ensure you fully understand the risks involved and seek independent advice if necessary.
- English (UK)
- English (India)
- English (Canada)
- English (Australia)
- English (South Africa)
- English (Philippines)
- English (Nigeria)
- Deutsch
- Español (España)
- Español (México)
- Français
- Italiano
- Nederlands
- Português (Portugal)
- Polski
- Português (Brasil)
- Русский
- Türkçe
- العربية
- Ελληνικά
- Svenska
- Suomi
- עברית
- 日本語
- 한국어
- 简体中文
- 繁體中文
- Bahasa Indonesia
- Bahasa Melayu
- ไทย
- Tiếng Việt
- हिंदी
GBP/USD Attempts To Continue Upside Recovery
ByFX Solutions
AuthorJames Chen
Published 04/30/2013, 12:40 AM
Updated 01/01/2017, 02:20 AM
GBP/USD Attempts To Continue Upside Recovery
Latest comments
Loading next article…
Install Our App
Risk Disclosure: Trading in financial instruments and/or cryptocurrencies involves high risks including the risk of losing some, or all, of your investment amount, and may not be suitable for all investors. Prices of cryptocurrencies are extremely volatile and may be affected by external factors such as financial, regulatory or political events. Trading on margin increases the financial risks.
Before deciding to trade in financial instrument or cryptocurrencies you should be fully informed of the risks and costs associated with trading the financial markets, carefully consider your investment objectives, level of experience, and risk appetite, and seek professional advice where needed.
Fusion Media would like to remind you that the data contained in this website is not necessarily real-time nor accurate. The data and prices on the website are not necessarily provided by any market or exchange, but may be provided by market makers, and so prices may not be accurate and may differ from the actual price at any given market, meaning prices are indicative and not appropriate for trading purposes. Fusion Media and any provider of the data contained in this website will not accept liability for any loss or damage as a result of your trading, or your reliance on the information contained within this website.
It is prohibited to use, store, reproduce, display, modify, transmit or distribute the data contained in this website without the explicit prior written permission of Fusion Media and/or the data provider. All intellectual property rights are reserved by the providers and/or the exchange providing the data contained in this website.
Fusion Media may be compensated by the advertisers that appear on the website, based on your interaction with the advertisements or advertisers.
© 2007-2024 - Fusion Media Limited. All Rights Reserved.