
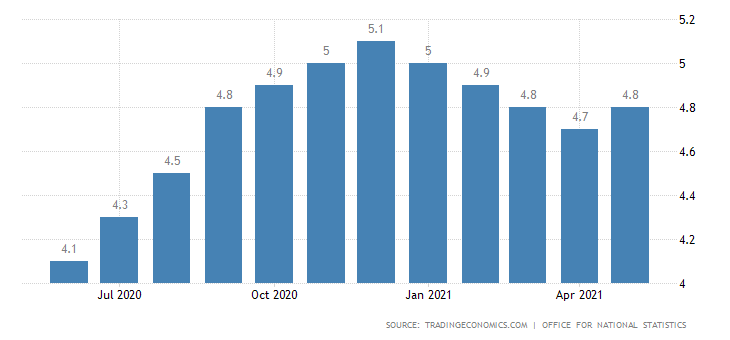
Since early morning on Thursday, the pound sterling went through a series of wild swings. Such turbulence was caused mainly by mixed data on the UK labor market. The jobless rate edged up to 4.8% in May from 4.7% in April whereas economists had projected the flat reading. This particular data set the stage for the rollercoaster in the market. In response, the sterling slumped.
However, it regained footing as market participants overcame their disappointment with growing unemployment and eventually turned attention to the claimant count change as its number contracted 115K in June. This is a humongous change for the UK.
The thing is that the unemployment data reflect the situation in May but the claimant count change mirrors the data for June. In other words, the uptick in the jobless rate is a transitory phenomenon. Analysts expect to see a serious decline in unemployment next month. Nevertheless, the pound sterling was gyrating for a while until the market calmed down.
UK Unemployment Rate
The market was able to set the direction for the pound only after the publication of US macroeconomic data. Oddly enough, the market response was not quite adequate. Originally, upbeat unemployment claims in the US produced no effect on the market, though the number of initial jobless claims dropped 26K last week and the number of continuing applications shrank another 126K.
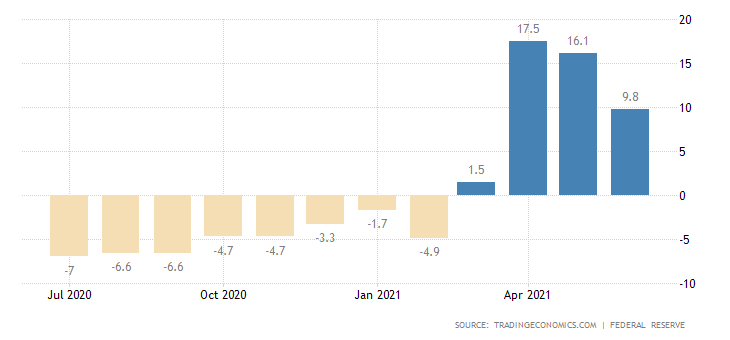
Even a 0.4% increase in the US industrial production left the market unimpressed. In fact, the industrial output slowed down the pace of growth to 9.8% in June from 16.1% from a year ago. However, the annual reading is still disfigured by the low base effect so that it is difficult to make an accurate conclusion based on this data. All in all, the US presented a batch of decent data, but the market grasped the point only an hour after its publication. Eventually, the US dollar carried on with its advance.
US Industrial Production
GBP/USD again was the instrument of big speculative interest that triggered a series of wild swings. The currency pair was trading in the channel of 1.3800 to 1.3900. These borders were first recorded on July 14.
Amid high speculative activity, the market dynamic is accelerating. The average daily candlestick is measured at 88 points since Monday.
Currently the pair is making a minor retracement where 1.3800 serves as support.
We can assume that GBP/USD will remain inside the range of 1.3800 to 1.3900 for a while until it makes the next price move.
To put it simple, the trading decision will be based on the direction in which the price will break one of the borders. In terms of complex indicator analysis, technical tools on a 1-hour and daily charts are generating sell signals.
InstaForex Group