The price of gasoline jumped 9.1% in March accounting for nearly half of the seasonally adjusted increase in the CPI.

Largest Monthly Leap Since August 2012
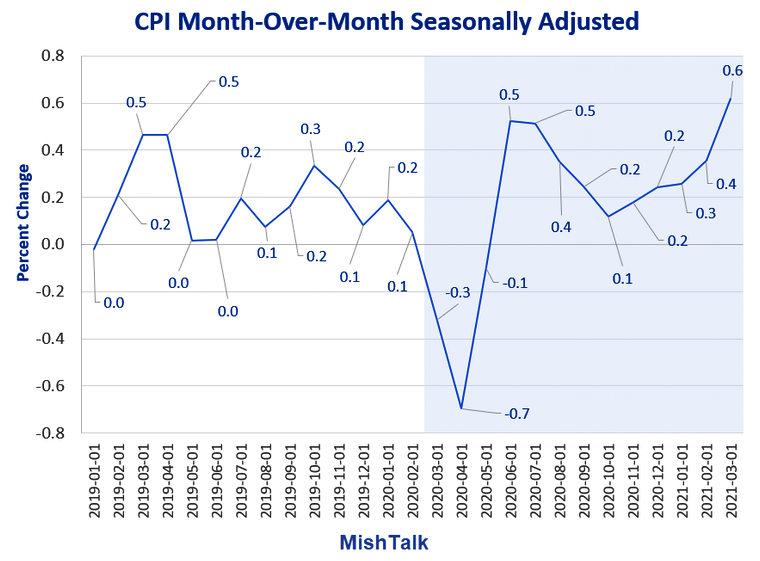
The BLS reports the Largest Month-Over-Month CPI Increase since August of 2012.
Month-Over-Month Details
- The Consumer Price Index for All Urban Consumers (CPI-U) increased 0.6 percent in March on a seasonally adjusted basis after rising 0.4 percent in February.
- The March 1-month increase was the largest rise since a 0.6-percent increase in August 2012.
- The gasoline index continued to increase, rising 9.1 percent in March and accounting for nearly half of the seasonally adjusted increase in the all items index. The natural gas index also rose, contributing to a 5.0-percent increase in the energy index over the month.
- The food index rose 0.1 percent in March, with the food at home index and the food away from home index both also rising 0.1 percent.
- The shelter index increased in March as did the motor vehicle insurance index, the recreation index, and the household furnishings and operations index.
- Indexes which decreased over the month include apparel and education.
- The index for all items less food and energy rose 0.3 percent in March.
CPI Year-Over-Year

Year-Over-Year Details
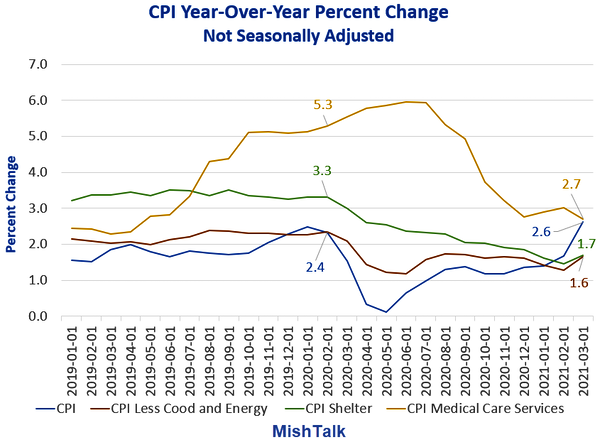
- Over the last 12 months, the all items index increased 2.6 percent before seasonal adjustment, a larger increase than the 1.7-percent reported for the period ending in February.
- The index for all items less food and energy rose 1.6 percent over the last 12 months, after increasing 1.3 percent over the 12 month period ending in February.
- The food index rose 3.5 percent over the last 12 months, while the energy index increased 13.2 percent over that period.
Medical Inflation
The CPI seriously underweights medical expenses by averaging in Medicare and Medicaid.
Healthcare services make up 17.75% of the PPI but only 6.97% of the CPI.
Ask anyone who buys their own medical insurance how fast rates are really rising.
For discussion please see Healthcare is the Biggest PPI Component With Over 3 Times Energy's Weight
Energy
Motor fuel is only 3.76% of the CPI. Even still, the 9.1% spike in gasoline contributed about half of the monthly increase.
Looking for Inflation?
It's easy to have "low inflation" when you don't count housing and undercount the cost of medical care.
Inflation is easy to find. Look at housing. Look at asset bubbles in stocks and junk bonds.
Case-Shiller Home Price Indexes

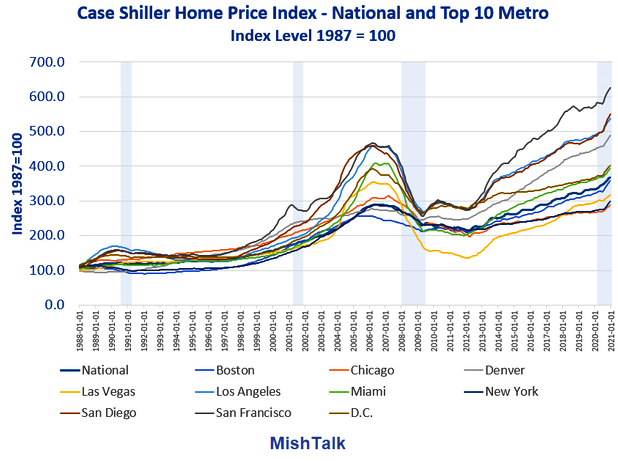
That chart shows repeat sales of the same house, a far better metric than median home prices, the most widely used measure of home prices.
Year-over-year, the CPI is only up 2.4%. The shelter index is up a mere 1.7%.
The Case Shiller National Home Price Index (December) is up a whopping 10.3%.
Home prices are not in the CPI, only rent and presumed rent one would pay as if renting one's house from oneself.
Presumed rent is called Owners' Equivalent Rent (OER) and it is the single largest component of the CPI with a weight of 24.26%.
If you are looking for inflation, the last place to look is where they tell you to look.
