Lately and over the course of several articles, I and my colleague Dan Russo, Chief Market Strategist at Chaikin Analytics, have been advocating in favor of ETFs that emphasize innovation-focused companies, the ones that have the potential to become the FANMAGs of tomorrow.
I suspect more articles along these lines will be forthcoming. But we’ve heard such things before, haven’t we. Think back to the late 1990s and early 2000s. Lots of great things came from that era, but there was an ugly underside: Many investors who bought stock back then were financially decapitated by what ultimately turned out to be extreme stock over-valuation. It’s therefore important to consider whether this time is different, whether investors who buy these ETFs and/or stocks are likely to again get slammed by the great-company-horribly-priced-stock conundrum.
Valuation Is A Lot Harder Than Many Realize
If stock valuation was about nothing more than looking at ratios (P/E, P/S, EV/S, P/B, Your FancyNewMetric/AnotherCoolNewMetric, a first-grader would be an expert, perhaps even a pre-schooler (I forget the age at which kids learn to count). Interestingly, though, many investors, even experienced knowledgeable investors including perhaps most or even all of the PhD/Quant community are loath to even consider moving beyond a simple high-to-low ratio sort.
Oddly, though, when we look away from the stock market and at all the rest of life, nobody would think for a moment that low price is always good and that high price is always bad. There’s a reason why Dollar General (NYSE:DG) doesn’t have a store on Rodeo Drive in Beverly Hills or Worth avenue in Palm Beach. Price cannot be evaluated as too high or too low in isolation. It must be done in relation to the nature and quality of what you get for your money.
Everybody understands this when it comes to houses cars, apparel, food, etc., etc., etc. But for some reason, that fundamental aspect of sanity is quickly tossed out the window when one tries to value a stock. No wonder so many of today’s quants are so perplexed about the great value inversion in which high P/E outperformed low P/E.
A Bit Of Valuation Theory
There is no single way to value a stock. There can’t be. We’re dealing with the unknowable future so all any of us can do is guesstimate. Valuation proficiency is about the difference between well-reasoned guesstimates versus badly-reasoned guesstimates. Ideally, all guesstimates would be based on the relationship between today’s stock price and the present value of cash flows expected to be received in the future as an incident of share ownership. But seriously, that’s an invitation to piling error on top of error on top of error.
(That said, if you absolutely positively feel you must value stocks this way, at least try to do it well. I suggest keeping abreast of the work of Dr. Aswath Damodaran and his books, particularly “The Dark Side of Valuation.” Or, you might check the Residual Income Model, which dramatically reduces the number of necessary inputs. Adapting from the work of Stanford’s Dr. Charles M.C. Lee, I discuss it here along with presentation of an Excel template you can use to implement it.
Ultimately, however, I prefer a less formal, less error-prone approach.
For those who want to get right to the finish line, I’ll say now that an ideal price/something ratio is one that derives one way or another from what is known as the Gordon Dividend Discount Model (which most finance students learn very early in the first investment finance class they take and probably ignore once the exam is finished, which is a shame because the theory, although it does not lend itself to a real-world plug-and-play spreadsheet, can serve as is a magnificent and thus-far unsurpassed intellectual valuation roadmap that has tremendous real-world implications).
For stocks of the sort being discussed now—high-growth potential future FANMAGs—I propose that Enterprise Value/Sales is a great metric (don’t get hung up on precise definitions of EV; adding debt to market cap will provide a perfectly fine numerator). The formula for an ideal EV/S is:
- EV / S = M / (R-G), where
- EV = Enterprise Value, M = Margin, R = Required rate of Annual Return and G = Expected future Growth
Again, and I can’t say this enough, we’re dealing with imprecision, the unknowable future. Pick a margin, any margin (I like working with Gross and Operating margins because they tend to be the ones most closely associated with the day-to-day business, as opposed to other kinds of corporate “stuff.” For R pick any measure of business risk that appeals to you, whether academic Beta or as I prefer, fundamental quality metrics associated with revenue and profit stability and, by implication, stock stability).
Similar formulations can be derived for P/E, P/B, P/FCF, EV/FCF, or any other ratio. (See the above-referenced cheat-sheet for details.)
The takeaway from this is that EV/S or P/S is not too high or too low in and of itself, but only as it relates to:
- G, expectations of future growth (which expectations can be derived in countless objective and subjective ways) with higher expected growth being associated with higher fair EV/S;
- M, margin not just where margin stands today but where it can be expected to go in the future — often for future fANMAG-type companies, expect Operating Margin to grow over time was operations mature and scale
- R expected returns, which depends on interest rates (lower rates associated with higher ratios) and company-specific business risk, with diminishing risk (to be expected as businesses scale and mature) justifying higher margins
If someone absolutely insists on trying to plug numbers in for G, M and R, good luck and have fun — but I don’t recommend doing that. Realistically, I propose that we’re better off just focusing on the relationships and looking for clues that suggest a higher probability of EV/S being favorably or unfavorably aligned with M/(R-G).
This is a combination of art and science with a heck of a big skew toward art: It’s about the future, so that’s how it has to be. (What science there is functions only to help us develop our art, much the way better quality brushes and paints help an oil painter.)
Implementing Theory
There are two broad categories of implementation, both of which can be very effective, individually or together.
- Pre-Qualified (Filtered/Screened) Ranking: Sort valuation ratios from low to high but do so on a pre-qualified subset of the market from which companies that deserve low ratios (because of bad growth prospects and/or poor business-risk profiles) have been weeded out.
- Multi-factor Ranking: Rank on a wide variety of factors that address valuation, growth, and business risk.
I work with both approaches using the 20-factor Chaikin Analytics Power Gauge model.
Addressing Today’s Big Question: Should We Fear A Crash Among Future-FANMAG Type Stocks?
I’m not forecasting the market as a whole. There’s a lot to think about here; Coronavirus, the shape of the hoped-for economic recovery, trade issues, a presidential election and so forth. I don’t address this because it’s not in my wheel-house.
What I’m focusing on today is whether the future FANMAGs and the ETFs that invest n them face significant valuation dangers separate and apart from challenges that face the equity market as a whole.
There is a short-term concern. This past weekend, Dan told Chaikin Analytics clients:
“...growth is likely to continue to lead value but the path higher is unlikely to be a continuation of the almost perfect 45 degree angle up and to the right that has been in place since the March 23rd lows for QQQ (and) that the growth’s outperformance has become parabolic in the near-term and the ratio is stretched from the 200-day moving average.”
In other words, Dan is still bullish on the future FANMAGs but he is cautious about the near term. (Note, though, that the stretched growth-to-value relationship about which he speaks need not be corrected by growth moving down. It could also be adjusted by a rally in the mediocrities and dogs that make up much of the naive value universe. But I’m not holding my breath waiting for that.)
Study Design
I created a simple screen in ClariFi (the S&P platform we use today to compute the model) that selected stocks based on the following screening rules:
- The Power Gauge Factor valuation based on Sales is classified as Bearish or Very Bearish.
- The Power Gauge Factor valuation based on Free Cash Flow is classified as Bearish or Very Bearish.
- The Power Gauge Factor valuation based on Book Value is classified as Bearish or Very Bearish.
- The Power Gauge Factor valuation based on Estimated EPS for the Next Fiscal Year is classified as Bearish or Very Bearish.
- The overall Power Gauge Rank (including the aforementioned value-oriented factors as well as 16 others that relate one way or another to expectations/sentiment regarding future business prospects and business risk) is classified as Very Bullish, Bullish, Neutral + (a fundamentally bullish-ranked stock that was demoted to Neutral on the basis of a technical alert), or Neutral.
The idea here is to measure the extent to which strength in non-value factors (those that tell us something about the characteristics of the company whose stock we’re purchasing) were able to protect investors from the ravages of what was, back then, an overvalued-stocks crash.
The Results
Not many stocks passed muster. It takes a lot for stock with the highest valuation ratios to be sufficiently strong in enough other areas to offset the impact of high ratios (analogous to the way in which a house with an asking price of $10 million would have to have a lot more going for it than a house priced at $500,000).
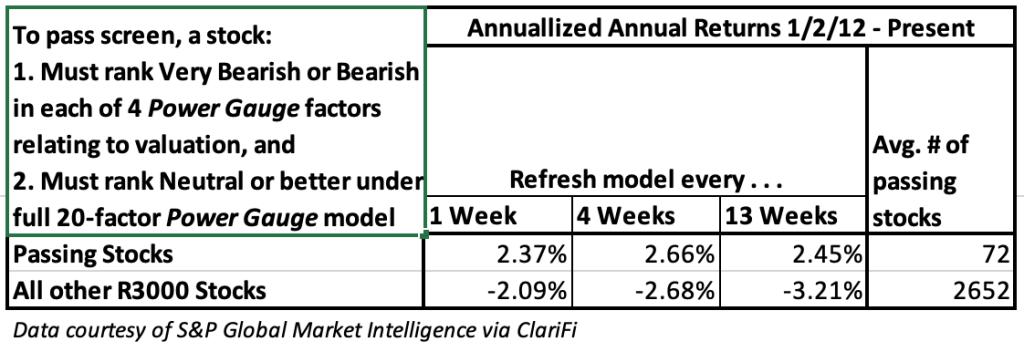
Here are the overall performance results for the period during which the model was in live use (in quant-speak, this is the “out-of-sample” period). In all cases, stocks are drawn from the Russell 3000 (NYSE:IWV) universe and 1- 4- and 13-week refresh/rebalance intervals are examined.
Table 1

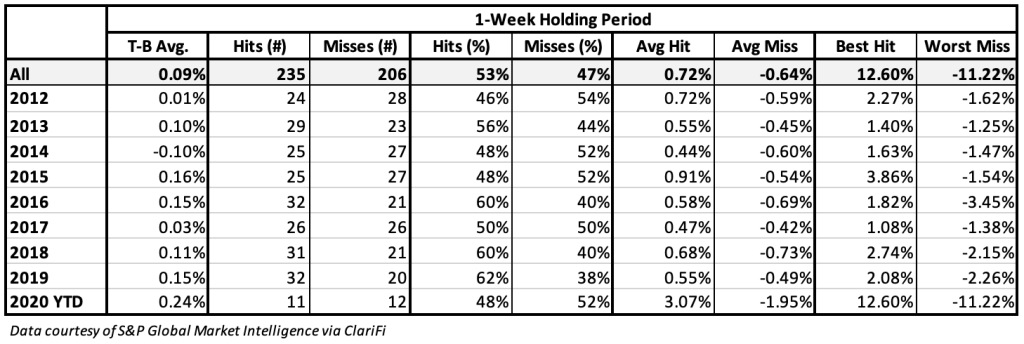
Tables 2, 3 and 4 show Top-Bottom (T_B) return comparisons. “Top” refers to the stocks that passed the screen. “Bottom” consists of stocks with all four Valuation factors being ranked Bearish or Very Bearish (as was done for the “Top” screen) but with the overall 20-factor overall Power Gauge model being Bearish or Very Bearish.
Table 2

Table 3

Table 4

That’s all well and good, but 2012-20 did not include a value-driven crash similar to what we experienced in 2000-02.
Fair enough. So let’s look specifically at 2000-02.
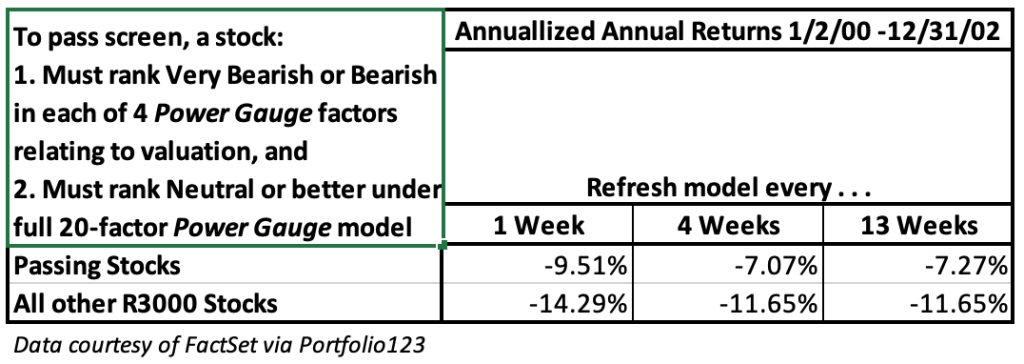
The Power Gauge model did not exist back then, but using Portfolio123 (the platform on which Power Gauge was originally designed) we can at least take what we can from backtested data. Table 5 shows backtested performance of screens similar to the ones referred to above.
Table 5

Memories
So how do the 2000-02 tests mesh with your memories of the time (assuming you were active in investing back then)? I’m guessing your recollection may suggest the numbers should look worse. That was my initial gut reaction.
But let’s consider the possibility that our memories of the crash, anecdotal in all likelihood, may have been worse than the reality in some important respects. Yes it was bad and yes some big-name stocks got badly pummeled. Index performance was dreadful, with SPDR S&P 500 ETF (NYSE:SPY) was down 37%, and the ETF now known as Invesco QQQ Trust Series 1 (QQQ) fell 74%.
Here, however, is an example of where memory can fool us. For one thing, a meaningful portion of the trauma reflected the shadow-momentum aspect of the market cap weighted indexes.
But even stock-specific recollections can be less clear than we might realize. Oracle (NYSE:ORCL) is an example of a circa-2000 darling that suffered horribly over the next two years, having fallen about 63%. Today, that stocks is 125% above where it was at the start of 2000, but it took more than 20 years to achieve that gain; it took until November 2010 for ORCL to recover to where it was on 1/2/00. Undoubtedly, many who were active in the market back in the day can recall plenty of other such situations.
At the start of the interval, ORCL would have had a Bullish Power Gauge rating. So it looks like the middle badly messed up here . . . maybe.
Be careful about drawing such a conclusion.
The overall rank actually fell to Bearish on June 19, 2000, at which time ORCL was priced 47% above where it stood at the start of the year. A month later, with the stock having fallen 11% from where it was in June (but still 29% above where it opened the year), the rank fell again, now to Very Bearish.
The stock and the ranked fluctuated after that; sometimes the rank moved ahead of the stock, other times the stock moved ahead of the rank. What’s important, though, is to recognize that memories, particularly emotionally tinged memories such as those many inherited from the 2000–02 crash, should not be allowed to supplant what the overall data is showing us.
On the whole, we do see that high-ratio stocks with enough strength in other characteristics to justify the valuations outperformed others that weren’t as strong in the 16 non-value factors
Conclusion
Future-FANMAG stocks and the ETFs that invest in them are accepting relatively high valuation ratios. But this, in and of itself, is neither good nor bad. Whether. these investment succeed will ultimately depend on whether the companies deliver on the promise of future growth and business stability upon which high valuations are based, and whether investors and ETFs are diligent in monitoring positions, whether through models and/or active judgment to hold positions in companies that are on track and replacing those that aren’t.
Many of the ETFs that hold these stocks are global and hence are rated using a Technical-Analysis only portion of the PortfolioWise ETF Power Rank (Power Gauge itself is only available for U.S. Equities). I believe the rank performance data presented on July 1st, coupled with the data presented here today, combine to suggest that the processes through which Mr. Market assesses the portfolios of these ETFs is aligned with the considerations (the relationships between observed valuation ratios and the valuation rations deserved based on the merits of the companies).
